- Home
- /
- SAS Viya
- /
- Visual Analytics
- /
- Re: Network Diagram Links
- RSS Feed
- Mark Topic as New
- Mark Topic as Read
- Float this Topic for Current User
- Bookmark
- Subscribe
- Mute
- Printer Friendly Page

- Mark as New
- Bookmark
- Subscribe
- Mute
- RSS Feed
- Permalink
- Report Inappropriate Content
Hi all, hoping for some help.
I have a very simple data set which lists the names of people that were mentioned in a talk. The dataset has 2 columns - personName and talkName.
e.g.
| personName | talkName |
|---|---|
| John Smith | 123 |
| John Smith | 234 |
| Bob Jones | 123 |
I want to create a Network Diagram in VA Explorer which shows all persons, and links them if they were mentioned in the same talk. So in the example above, John Smith should be linked to Bob Jones, since talkName matches.
I believed I could do this using an "Ungrouped" network type, and setting the Target to personName, and Source to talkName. All the people are shown in the network diagram, but with no links.
Does anyone know if I'm missing something?
Thanks,
Seb
Accepted Solutions

- Mark as New
- Bookmark
- Subscribe
- Mute
- RSS Feed
- Permalink
- Report Inappropriate Content
Hi Seb,
The values for your talkName column need to contain a subset of your personName column - that is how they link for it to be networked... In the documentation, it states: The basic data roles for an ungrouped network diagram are the Source and the Target. The Source specifies a category that contains all of the node values for the plot. The Target specifies a category that creates the links between nodes. The Target category must contain a subset of the values of the Source category. SAS(R) Visual Analytics 6.4: User's Guide
You might find 's blog post on networks a useful read - Exploring social networks with SAS Visual Analytics - SAS Voices
Kind Regards,
Michelle

- Mark as New
- Bookmark
- Subscribe
- Mute
- RSS Feed
- Permalink
- Report Inappropriate Content
Hi Seb,
Have a look at the SAS Global Forum Paper From Traffic to Twitter – Exploring Networks with SAS Visual Analytics and check out the section for ungrouped networks. As mentioned - you will also need to have all target categories listed in the source column (with an empty target). This is necessary as we are only utilising one table here (vs. the typical node and edge tables). These additional rows will let you specify node attributes for leaf nodes. In your example above - you should have gotten a warning at the bottom of the graph indicating this issue.
Hope this helps. Cheers, Falko
- Mark as New
- Bookmark
- Subscribe
- Mute
- RSS Feed
- Permalink
- Report Inappropriate Content
Thanks a lot for your help. You were correct, of course; I've added new rows with each target category in the source column, and my network now shows links:
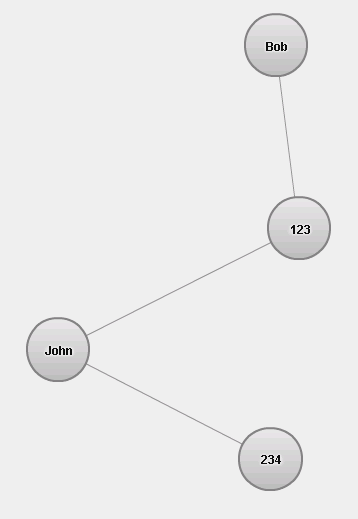
Ideally I really wanted this to resolve to a situation where John would be linked directly to Bob because they shared the same talk.
I assume that the correct way to do this would actually be to change my data to remove the concept of talknames, and instead make the "target" column also contain person names? e.g.
| Person1 | Person2 |
|---|---|
| John Smith | Bob Jones |
| Bob Jones |
Again, thanks for the advice. I had misinterpreted the concept.
Cheers,
Seb
- Mark as New
- Bookmark
- Subscribe
- Mute
- RSS Feed
- Permalink
- Report Inappropriate Content
Typically, you have one source and one target column indicating the actual link between two entities. In your example you would probably use a user id's (as names may not be unique) in both of these columns. You can add additional node attributes in additional columns and assign to other roles in the network, e.g. data tips.
An example table as follow:
| SOURCE | TARGET | NAME | talkName |
|---|---|---|---|
| USER1 | USER2 | John Smith | 123 |
| USER2 | Bob Jones | 123 | |
| USER1 | USER3 | John Smith | 123 |
| USER3 | Simon | 234 |
You can assign NAME/talkName as other attributes in the network diagram. Note, that I added Bob (USER2) and Simon (USER3) as additional rows without a TARGET value - this way you can assign attributes such as name and talkName to both user id's.
Hope this makes sense. Cheers, Falko
- Mark as New
- Bookmark
- Subscribe
- Mute
- RSS Feed
- Permalink
- Report Inappropriate Content
Hi Falco,
Thanks for the help. Yes, that makes absolute sense. In fact I did actually choose to use unique IDs, but I didn't want to complicate my example with those!
This is maybe out of the bounds of the original topic, but is there a standard approach for converting data from the original structure I posted into the new source-target structure? I thought I could do it through some creative use of the MERGE function but I've not managed it so far...
Cheers,
Seb
- Mark as New
- Bookmark
- Subscribe
- Mute
- RSS Feed
- Permalink
- Report Inappropriate Content
Well, there is no generic approach in getting this automated as there are many different ways to describe a relationship. In your example you define the relationship as user1.talkName = user2.talkName but there could be others such as user1.lastName eq user2.lastName, etc. In social networks you often take a predefinied relationship such as user1 follows user2.
A simple SQL join on your data by comparing the talkName would probably create the required structure. However you will find that a merge like this will produce a link from user1->user2 as well as link from user2->user1 as both are valid conditions for the relationship before. While VA can handle multi-links between entities its a rather confusing network to look at. You may also want to consider introducing additional nodes in your network such as the actual talkName so users who are mentioned in each talk are grouped/clustered together. Also, include some additional measures / categories which you can use to highlight stronger or weaker relationships (VA allows you to visualize this by using wider links or different colors). Maybe check out the OPTGRAPH procedure if you have access to it as this provides a great set of additional network algorithms and can give you additional measures such as Eigenvector or degree - important measures when doing social network analysis.
Cheers, Falko

- Mark as New
- Bookmark
- Subscribe
- Mute
- RSS Feed
- Permalink
- Report Inappropriate Content
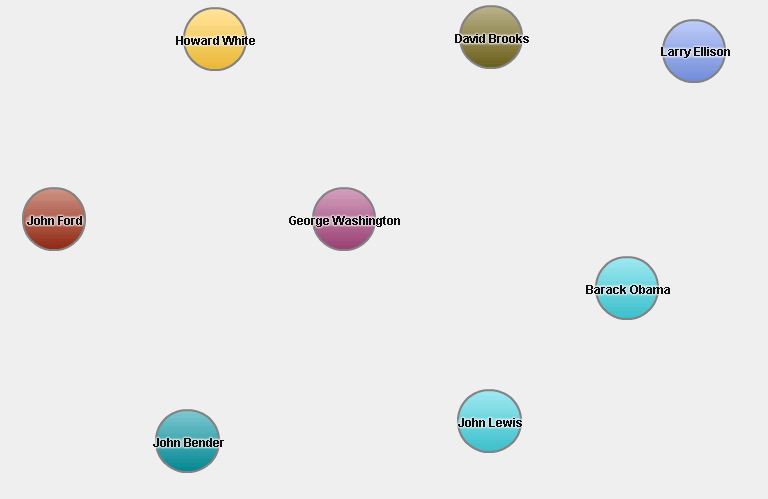
try using filter to make specific pic undet talk name. by this way you can only associate your nodes to the specified talkname that you have selected. I used one of this for route optimization model.
satlr
.jpg")
Catch up on SAS Innovate 2026
Nearly 200 sessions are now available on demand with the SAS Innovate Digital Pass.
Explore Now →See how to use one filter for multiple data sources by mapping your data from SAS’ Alexandria McCall.

Find more tutorials on the SAS Users YouTube channel.
-
7 replies
-
08-12-2014 12:14 PM
-
7444 views
-
4 likes
-
4 in conversation
-
