- Home
- /
- SAS Viya
- /
- Visual Analytics
- /
- Max connection date of users in a table : works only with TreastAs num...
- RSS Feed
- Mark Topic as New
- Mark Topic as Read
- Float this Topic for Current User
- Bookmark
- Subscribe
- Mute
- Printer Friendly Page
- Mark as New
- Bookmark
- Subscribe
- Mute
- RSS Feed
- Permalink
- Report Inappropriate Content
Dear all,
Here is my situation : I have a datasource with a row for each connection of a username in a system.
I'm building a report with many statistics, and in the last tab, I want to display in a table the most recent connection date for each users.
I've been fighting with this and can't stand it now.
Using Rank does not work, since it either shows multiple dates for each users or only the group of users that gets connected on the most recent date (like today or yesterday). For those who got connected earlier, they are treated as "others" and not displayed !
I found a way to display the table properly but it ONLY WORKS when the date is converted to a number TreasAs...
First : basic table with names & date, you see that there are as many rows as date & username.
Second, if i try to create a rank on a TreasAs Date (number), then it only shows the group of people that get connected on the most recent day together, the others are treated separetly.
Then if I only put in the table the TreasAs Date (number), it WORKS ! I have my most recent date for each and all users, but in a numeric format !!!
HELP !!
thanks
- Mark as New
- Bookmark
- Subscribe
- Mute
- RSS Feed
- Permalink
- Report Inappropriate Content
Please do NOT post data in pictures. See the links in my footnote for advice on posting example data.
A data step allows all possible helpers to recreate your dataset with a simple copy/paste and submit.
A proc sql solution would look like
proc sql;
create table want as
select userid, max(connection_date) as maxdate
from have
group by userid;
quit;- Mark as New
- Bookmark
- Subscribe
- Mute
- RSS Feed
- Permalink
- Report Inappropriate Content
ok thanks for the advice.
the proc solution is not a good one, since it will remove all the "detailed data" i need for other graphs and table in my report.
- Mark as New
- Bookmark
- Subscribe
- Mute
- RSS Feed
- Permalink
- Report Inappropriate Content
About the display of dates: you need to assign a date format to the newly created variable, which would be yymmdd10. in your case.
- Mark as New
- Bookmark
- Subscribe
- Mute
- RSS Feed
- Permalink
- Report Inappropriate Content
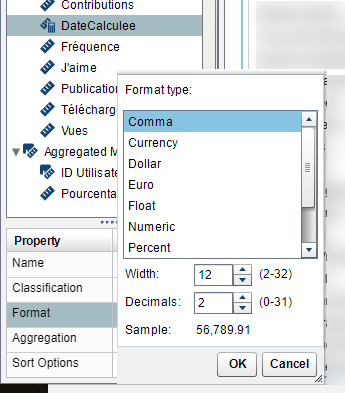
That's what I thought also, but the date format is not available :
And I also tried to re-create a calculated item from the numbered date format to a real date format using but then the behaviour comes back to the detailed view and not the (max) date.
April 27 – 30 | Gaylord Texan | Grapevine, Texas
Registration is open
Walk in ready to learn. Walk out ready to deliver. This is the data and AI conference you can't afford to miss.
Register now and lock in 2025 pricing—just $495!
See how to use one filter for multiple data sources by mapping your data from SAS’ Alexandria McCall.
Find more tutorials on the SAS Users YouTube channel.


