- Home
- /
- SAS Viya
- /
- Visual Analytics
- /
- Geomap - link different cities/countries
- RSS Feed
- Mark Topic as New
- Mark Topic as Read
- Float this Topic for Current User
- Bookmark
- Subscribe
- Mute
- Printer Friendly Page

- Mark as New
- Bookmark
- Subscribe
- Mute
- RSS Feed
- Permalink
- Report Inappropriate Content
Hello SAS Community,
do you have any idea if it is possible to link e.g. Paris with Mailand with a line on a geographical map to represent e.g. the flow of products form Paris to Mailand?
If this is possible, then what is needed to do upfront or to produce such a geomap?
Thank you
Best Regards,
Markus
Accepted Solutions

- Mark as New
- Bookmark
- Subscribe
- Mute
- RSS Feed
- Permalink
- Report Inappropriate Content
Fortunately, Falko and Nascif's SAS Global Forum 2014 paper is available to download at https://sasglobalforum.activeevents.com/connect/sessionDetail.ww?SESSION_ID=1911
Also Falko wrote some great blog posts that you may also find useful references...
http://blogs.sas.com/content/sascom/2014/02/19/exploring-social-networks-with-sas-visual-analytics/
http://blogs.sas.com/content/sgf/2013/12/19/santas-route-in-sas-visual-analytics/

- Mark as New
- Bookmark
- Subscribe
- Mute
- RSS Feed
- Permalink
- Report Inappropriate Content
Proc Gmap would do this. You would need a map data set for boundaries and coordinates of the points of interest, preferrably in the same coordinate system. Then use an annotate data set to draw a line of the desired characteristics between the given point pairs.
This page http://support.sas.com/kb/24/897.html shows an example of how to plot cities on a map using United States data and connect them with lines and label a value.

- Mark as New
- Bookmark
- Subscribe
- Mute
- RSS Feed
- Permalink
- Report Inappropriate Content
Hi Markus,
What version of VA are you running?
In the newest version of VA we allow a network diagram to sit on a geo map which would give you want you want I believe.
Regards,
Justin
- Mark as New
- Bookmark
- Subscribe
- Mute
- RSS Feed
- Permalink
- Report Inappropriate Content
Hi Justin,
we are on a 6.3 Version.
Thank you
Regards,
Markus

- Mark as New
- Bookmark
- Subscribe
- Mute
- RSS Feed
- Permalink
- Report Inappropriate Content
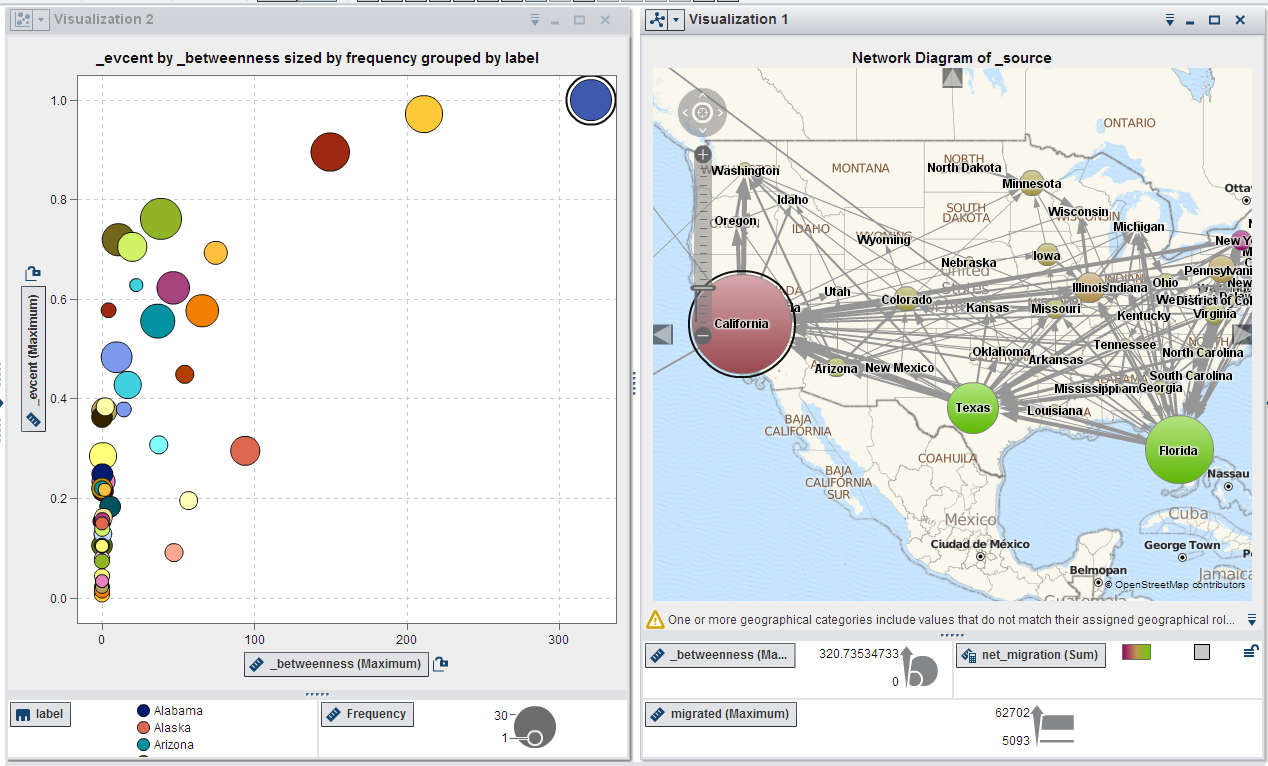
Here is an example combining network analysis can be combined with network visualization over maps in the SAS Visual Analytics Explorer.
We will be discussing this at the SAS Global Forum 2014 in Washington D.C.
- Mark as New
- Bookmark
- Subscribe
- Mute
- RSS Feed
- Permalink
- Report Inappropriate Content
Great, that is exactly what I'm looking for. Is there any chance to get a kind of manual on how to do that. What needs to be done in the backend and what needs to be done in the frontend?
Unfortunatley I'm located in Europe and have no chance to attend the SAS Global Forum, unless there is a kind of webinar to follow this subject.
- Mark as New
- Bookmark
- Subscribe
- Mute
- RSS Feed
- Permalink
- Report Inappropriate Content
Fortunately, Falko and Nascif's SAS Global Forum 2014 paper is available to download at https://sasglobalforum.activeevents.com/connect/sessionDetail.ww?SESSION_ID=1911
Also Falko wrote some great blog posts that you may also find useful references...
http://blogs.sas.com/content/sascom/2014/02/19/exploring-social-networks-with-sas-visual-analytics/
http://blogs.sas.com/content/sgf/2013/12/19/santas-route-in-sas-visual-analytics/
- Mark as New
- Bookmark
- Subscribe
- Mute
- RSS Feed
- Permalink
- Report Inappropriate Content
Just beat me to it! 🙂

Available on demand!
Missed SAS Innovate Las Vegas? Watch all the action for free! View the keynotes, general sessions and 22 breakouts on demand.
See how to use one filter for multiple data sources by mapping your data from SAS’ Alexandria McCall.

Find more tutorials on the SAS Users YouTube channel.
-
7 replies
-
03-07-2014 10:21 AM
-
3355 views
-
6 likes
-
5 in conversation
-
