I'm just starting my VA/VIYA journey, and trying to find a way to have the kind of functionality you get natively in VA, with selection boxes and dropdowns and so on, but being able to generate traditional SAS graphics.
I realise there are ways to use javascript and other external graphics engines, but for now i want to stick with SAS!
I have followed the example given here: ODS Output with Embedded Graphics
And have an output.
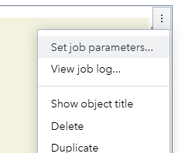
However, if I want to run it again (in this example it would be to change the colours, but ultimately i would be passing new parameters to an SGPLOT or a macro) I have to go to the "Set job parameters" menu item

My question: Is there a way to have the parameters HTML visible at all times, possibly even in another window, and have a "submit" button that would then update the ODS output?
Sort of like a budget version of the VA sliders/radio/dropdowns, but that can control an ODS output?
I have seen an example from using a Kaplan Meier curve that could be manipulated with parameters, but I just want to get a really simple example working.
Everything I've read so far talks about Javascript and XML, but I have the data already in CASLIBS and want to just use subsets of data with some ODS SG procedures.
Thanks!