- Home
- /
- Analytics
- /
- Stat Procs
- /
- Proc genmod - estimate at each visit
- RSS Feed
- Mark Topic as New
- Mark Topic as Read
- Float this Topic for Current User
- Bookmark
- Subscribe
- Mute
- Printer Friendly Page

- Mark as New
- Bookmark
- Subscribe
- Mute
- RSS Feed
- Permalink
- Report Inappropriate Content
Dear Steve,
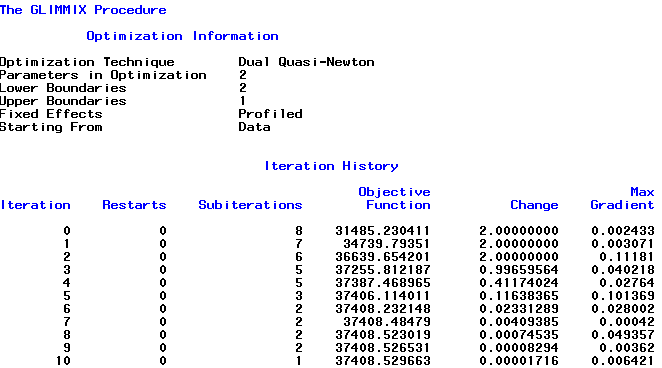
Thank you very much for your help. It looks better... See below the iteration history:
As you can see below, Objective function = 37408 from iteration 6 to iteration 199.
...

I have seen that there are a lot of option regarding the convergence (PCONV, ABSCONV, ABSFCONV, ABSGCONV, ABSXCONV, FCONV, GCONV). How criterion would you use to relax the convergence criterion ?
Violaine

- Mark as New
- Bookmark
- Subscribe
- Mute
- RSS Feed
- Permalink
- Report Inappropriate Content
First step, I would increase maxiter to 1000.
PCONV is the only one that directly affects the outer loop process. It looks at the parameter set convergence. I generally try to "sneak up" on it. The default is 1e-8, so I generally try PCONV=1e-7 as my first attempt. All of the other options refer to the inner loop process and are put in the NLOPTIONS statement. Unless there is a warning in the log that something is failing in the inner loop, I would recommend staying away from these.
Steve Denham
- Mark as New
- Bookmark
- Subscribe
- Mute
- RSS Feed
- Permalink
- Report Inappropriate Content
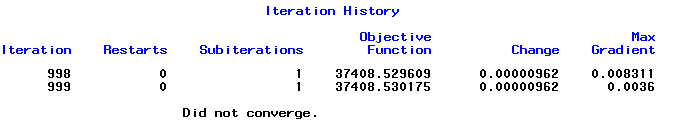
I have increased maxiter to 1000. Proc glimmix took about 20 minutes to run, and it didn't converge. See below the last part of the iteration history:
Again, the Objective function stays close to 37408.
Thanks for your thoughts,
Violaine
- Mark as New
- Bookmark
- Subscribe
- Mute
- RSS Feed
- Permalink
- Report Inappropriate Content
Time to use PCONV. You are close to convergence. Start with PCONV=1e-7, and if that doesn't work, choose slightly larger values until you get convergence.
Steve Denham
- Mark as New
- Bookmark
- Subscribe
- Mute
- RSS Feed
- Permalink
- Report Inappropriate Content
The following code works and converges:
proc glimmix data = efftab pconv=1e-5 ;
weekcont=week;
class usubjid trt01pn week country ;
model respfn = week trt01pn week*trt01pn / noint dist=bin link=logit ;
random week / subject=usubjid*country type=sp(pow)(weekcont) ;
*nloptions maxiter=200 ;
run ;
With the following results:
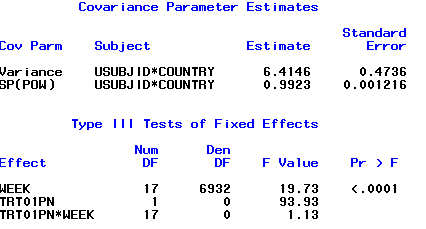
Then, I used the following statement to compute the OR at Week 1 for example :
estimate OR at WEEK 1" trt01pn 1 week 1 0 0 0 0 0 0 0 0 0 0 0 0 0 0 0 0 0
trt01pn*week 1 0 0 0 0 0 0 0 0 0 0 0 0 0 0 0 0 0 / exp ;
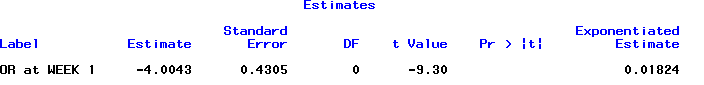
But it leads to the following result:
Did I make a mistake? I think that an OR cannot be negative, so I'm probably missing something. Also, in addition to the OR, I'd like to get the CI + p-value of the diff between trt group.
Thanks for any idea,
Violaine
- Mark as New
- Bookmark
- Subscribe
- Mute
- RSS Feed
- Permalink
- Report Inappropriate Content
I think to get an odds ratio, you have to have a difference between two groups as a starting point, so try using the ODDSRATIO in the MODEL statement.
However, there is still a problem with the model in that there are no denominator degrees of freedom for the treatment and treatment interaction. Try adding the between-within option to the model statement:
model respfn = week trt01pn week*trt01pn / noint dist=bin link=logit ddfm=bw;
Steve Denham
Message was edited by: Steve Denham
- Mark as New
- Bookmark
- Subscribe
- Mute
- RSS Feed
- Permalink
- Report Inappropriate Content
Dear Steve,
Thank you very much for answer answer. Indeed, it works better with the "ddfm=bw" option.
I have tried to use the "ODDSRATIO in the MODEL statement.", however I'm not sure to get what I really want (at each visit: OR of the proportion of responder in Active group versus PBO group).
I have to look further in the output result and SAS documentation.
Thank you!
Violaine
- Mark as New
- Bookmark
- Subscribe
- Mute
- RSS Feed
- Permalink
- Report Inappropriate Content
I think you will want the ODDSRATIO option in the model statement, and again in an LSMEANS statement. I believe you will be interested in the comparison at each week, so the slicediff= option comes into play. Try adding:
lsmeans week*trt01pn /slicediff=week oddsratio;
Steve Denham
- Mark as New
- Bookmark
- Subscribe
- Mute
- RSS Feed
- Permalink
- Report Inappropriate Content
Dear Steve,
This is my last updated code :
(Fyi, I have removed the country - as discussed and agreed in our team)
[1] proc glimmix data = efftab pconv=1e-5;
[1] weekcont=week;
[1] class usubjid trt01pn(ref='0') week ;
[1] model respfn = trt01pn week week*trt01pn / dist=bin link=logit ddfm=bw oddsratio ;
[1] random week / subject=usubjid type=sp(pow)(weekcont) ;
[2] lsmeans week*trt01pn /slicediff=week oddsratio cl ;
[3] estimate"OR of Active vs Pbo at Week 1" trt01pn 1 week 1 0 0 0 0 0 0 0 0 0 0 0 0 0 0 0 0 0
week*trt01pn 1 0 0 0 0 0 0 0 0 0 0 0 0 0 0 0 0 0 / exp ;
[1] run ;
[1] The "oddsratio" option from the MODEL statement :
It displays ORs for:
- TRT01PN=Active vs. PBO
- AVISITN=WEEK 1 vs WEEK 52
...
- AVISITN=WEEK 48 vs WEEK 52.
>> But it does not display the OR of Active vs. PBO at each Week. So, I think that I cannot use the information from the "oddsratio" option from the MODEL statement.
.
[3] The "estimate" statement :
The result from the SAS Output is "Non-est". Did I make an issue in the specification of this statement? (As a reminder, TRT01PN is coded 1 for Active vs 0 for Pbo). I don't see why it doesn't work.
[2] The "lsmeans" statement :
I guess that I can retrieve the Odds ratio, CI and p-value from the "Simple Effect Comparisons of TRT01PN*WEEK Least Squares Means By WEEK" table (ODS Table Name = SliceDiffs). Do I understand well ? These OR will be computed considering the main effect + the interaction too. Is it correct ? I was also wondering why we wouldn't use the slice option instead of slicediff ?
Thanks a million in advance for your support,
Best regards,
Violaine
- Mark as New
- Bookmark
- Subscribe
- Mute
- RSS Feed
- Permalink
- Report Inappropriate Content
Dear Steve,
I have done the 2 following prog glimmix and it has the following "Fit Statistics" :
Glimmix A (considering the real time with a spacial covariance structure):
proc glimmix data = efftab pconv=1e-5 ;
weekcont=week;
class trt01pn(ref='0') usubjid week ;
model respfn = trt01pn week trt01pn*week / dist=bin link=logit ddfm=bw ;
random week / subject=usubjid type=sp(pow)(weekcont) ;
lsmeans week*trt01pn /slicediff=week oddsratio cl ;
run ;

Glimmix B (considering the original visit variable avisitn with no special type of the covariance structure):
proc glimmix data = efftab pconv=1e-5 ;
class trt01pn(ref='0') usubjid avisitn ;
model respfn = trt01pn avisitn trt01pn*avisitn / dist=bin link=logit ddfm=bw ;
random avisitn / subject=usubjid ;
lsmeans avisitn*trt01pn /slicediff=avisitn oddsratio cl ;
run ;

Looking into the ratio of the generalized chi-square statistic and its degrees of freedom : it is close to 1 in Glimmix B. I understand that it indicates that the variability in these data has been properly modeled, and that there is no residual overdispersion.
Then, considering the Fit Statistics, I would consider the 2nd glimmix modeling (Glimmix B) instead. Could you please let me know your thoughts ?
Thanks so much,
Best regards,
Violaine
- Mark as New
- Bookmark
- Subscribe
- Mute
- RSS Feed
- Permalink
- Report Inappropriate Content
I am out of the office until next week, so this will be short.
The estimate statement is non-est because it doesn't compare anything at this point. To get a difference you have to code both parts of interest, one with a positive 1 the other with a negative 1. I think I gae an example.
I hope you can wait until next week when I get back to work.
Steve Denham
- « Previous
-
- 1
- 2
- Next »
SAS Innovate 2025: Call for Content
Are you ready for the spotlight? We're accepting content ideas for SAS Innovate 2025 to be held May 6-9 in Orlando, FL. The call is open until September 25. Read more here about why you should contribute and what is in it for you!
ANOVA, or Analysis Of Variance, is used to compare the averages or means of two or more populations to better understand how they differ. Watch this tutorial for more.

Find more tutorials on the SAS Users YouTube channel.
-
25 replies
-
04-09-2013 06:22 AM
-
4352 views
-
3 likes
-
2 in conversation
-
