- Home
- /
- Programming
- /
- Programming
- /
- Re: Sgplot Output Has Dashed Line
- RSS Feed
- Mark Topic as New
- Mark Topic as Read
- Float this Topic for Current User
- Bookmark
- Subscribe
- Mute
- Printer Friendly Page
- Mark as New
- Bookmark
- Subscribe
- Mute
- RSS Feed
- Permalink
- Report Inappropriate Content
Hi all,
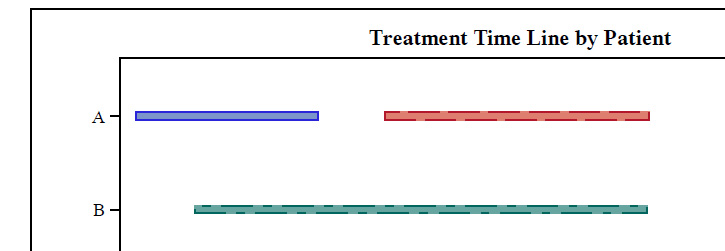
I am trying to produce a Sgplot graph using an example I found on the SAS website as a guide. Whenever I run it with my data or run the example given I get dashed lines around the bars. It does the first one with a solid border but subsequent ones are dashed.
I'm outputting to PDF and I've tried upping the dpi to no avail. I found a post stating that SAS 9.3 can use vector graphics but couldn't find where to tell SAS to do so. Here is the code and a screen dump of the result. Does anyone have a fix for this?
data trt;
input PatientID $ Start_date :date9. End_date :date9. Treatment;
format Start_date End_date date9.;
datalines;
A 05Jan2011 31Mar2011 1
A 01May2011 01Sep2011 2
B 01Feb2011 31Aug2011 3
C 15Jun2011 15Oct2011 1
D 15Jan2011 15Mar2011 1
D 01May2011 15Sep2011 2
D 01Oct2011 15Dec2011 3
E 01Apr2011 15Nov2011 1
;
run;
ods pdf file = "&dir\Test.pdf" notoc ;
title1 "Treatment Time Line by Patient";
proc sgplot data=trt;
highlow y=PatientID low=start_date high=end_date /
group=Treatment
type=bar
barwidth=0.1;
yaxis label="Patient ID" reverse;
xaxis label="Study Time";
run;
ods pdf close ;
Screen Dump:

I've tried using different styles as well as various graphic options but still get the same result.
cheers
Steve
Accepted Solutions
- Mark as New
- Bookmark
- Subscribe
- Mute
- RSS Feed
- Permalink
- Report Inappropriate Content
You may either need to try more styles or modify one. The style attribute Class GraphDataN, where n= 1 to 12 in styles has a LineStyle attribute that I believe is the source of your issue. Since the values in Styles.Default (at least in 9.2) have different line styles then you get either different lines in line graphs or borders as you show, and any style that inherits from that style without modifications to linestyle will exhibit the same behavior.
- Mark as New
- Bookmark
- Subscribe
- Mute
- RSS Feed
- Permalink
- Report Inappropriate Content
Finally got the desired result with the 'seaside' style. Thanks for the heads up.
cheers
Steve
Learn how use the CAT functions in SAS to join values from multiple variables into a single value.
Find more tutorials on the SAS Users YouTube channel.
SAS Training: Just a Click Away
Ready to level-up your skills? Choose your own adventure.


