- Home
- /
- Programming
- /
- SAS Procedures
- /
- Re: updating value conditionally from another table
- RSS Feed
- Mark Topic as New
- Mark Topic as Read
- Float this Topic for Current User
- Bookmark
- Subscribe
- Mute
- Printer Friendly Page

- Mark as New
- Bookmark
- Subscribe
- Mute
- RSS Feed
- Permalink
- Report Inappropriate Content
Hi
I have 2 sets of monthly sales data:
- Master data where all the updates need to be made
- Updated data
ABC variables are the name of each store and value in the table represent each store's monthly sales.
Each store has different opening date, so sales figures start from various timing depending on when it opened.
Master sales data
| Date | A | B | C |
| Jan-13 | 89 | ||
| Feb-13 | 19 | ||
| Mar-13 | 8 | ||
| Apr-13 | 73 | 57 | |
| May-13 | 38 | 76 | |
| Jun-13 | 33 | 55 | |
| Jul-13 | 67 | 4 | |
| Aug-13 | 33 | 65 | |
| Sep-13 | 91 | 15 | |
| Oct-13 | 30 | 35 | |
| Nov-13 | 52 | 45 | 3 |
| Dec-13 | 100 | 89 | 12 |
| Jan-14 | 39 | 39 | 9 |
| Feb-14 | 100 | 92 | 65 |
| Mar-14 | 86 | 46 | 61 |
Updated sales data
| Date | A | B | C |
| Jan-13 | 80 | ||
| Feb-13 | 80 | ||
| Mar-13 | 80 | ||
| Apr-13 | 80 | 57 | |
| May-13 | 80 | 76 | |
| Jun-13 | 33 | 55 | |
| Jul-13 | 67 | 4 | |
| Aug-13 | 33 | 65 | |
| Sep-13 | 91 | 15 | |
| Oct-13 | 30 | 35 | |
| Nov-13 | 45 | 3 | |
| Dec-13 | 100 | 89 | 12 |
| Jan-14 | 39 | 39 | 9 |
| Feb-14 | 100 | 92 | 65 |
| Mar-14 | 86 | 61 |
There are 2 data cleaning steps I coded in SAS:
1. Update master data table based on the updated data ONLY when the updated value is missing or blank. Value in the master data should NOT be modified if update is numerical value.
2. Replace sales figure with a missing value or blank for the first 3 months of store opening as the initial sales period is considered unstable
I did my best to follow the textbook in writing codes below, but I cannot resolve the errors...
I am guessing my array statement has an issue. If someone could let me know how I can resolve the issue, I really appreciate your help!
Below is the codes I wrote for step 1.
data work.master_sales;
set work.updated_sales;
modify work.master_sales work.updated_sales;
array consistent(*)_numeric_; /*I did not list all variables because there are over 100 stores in the real data set*/
if consistent(*)_numeric_=' ';
by date;
run;
Below is for step 2.
data work.master_sales;
set work.master_sales;
array firstyear(*)_numeric_;
do i=1 to 3 while (firstyear(i) ne' '); /*Replace sales figure with ' ' for the first 3 months of store opening*/
firstyear(i) = ' ';
end;
drop i;
Accepted Solutions

- Mark as New
- Bookmark
- Subscribe
- Mute
- RSS Feed
- Permalink
- Report Inappropriate Content
Hi, building on Art's clever idea, Here is the code for getting normal missing values everywhere you want them:
data master;
format date yymmd.;
infile datalines missover;
input D$ A B C;
date = input(cats("01-", D), date9.);
drop D;
datalines;
Jan-13 89
Feb-13 19
Mar-13 8
Apr-13 73 57
May-13 38 76
Jun-13 33 55
Jul-13 67 4
Aug-13 33 65
Sep-13 91 15
Oct-13 30 35
Nov-13 52 45 3
Dec-13 100 89 12
Jan-14 39 39 9
Feb-14 100 92 65
Mar-14 86 46 61
;
data updated;
format date yymmd.;
infile datalines missover;
input D$ A B C;
date = input(cats("01-", D), date9.);
drop D;
datalines;
Jan-13 80
Feb-13 80
Mar-13 80
Apr-13 80 57
May-13 80 76
Jun-13 33 55
Jul-13 67 4
Aug-13 33 65
Sep-13 91 15
Oct-13 30 35
Nov-13 . 45 3
Dec-13 100 89 12
Jan-14 39 39 9
Feb-14 100 92 65
Mar-14 86 . 61
;
/* Create a view from the update dataset where numerical sales are replaced with
normal missing values '.' which will be ignored in the update process and missing
sales are replaced with the special missing value '._' which will update the master
table sale to a normal missing value. */
data temp / view=temp;
set updated;
array sales A--C;
do i = 1 to dim(sales);
if missing(sales{i}) then sales{i}=._;
else call missing(sales{i});
end;
drop i;
run;
/* Update the master dataset */
data updatedMaster;
update master temp;
by date;
run;
/* Remove first three months of every store series */
/* Change the data structure to create proper time series */
proc transpose data=updatedMaster out=longMaster(where=(col1 is not missing));
by date;
run;
/* Change sales to missing for the first three months from each time series */
proc sql;
create table longMasterTrim as
select date, _name_,
case when date < intnx("MONTH", min(date), 3) then .
else COL1 end as sales
from longMaster
group by _name_
order by date, _name_;
quit;
/* Reorganize the time series horizontally */
proc transpose data=longMasterTrim out=wantedMaster(drop=_name_);
by date;
id _name_;
var sales;
run;
proc print data=wantedMaster noobs; run;
PG

- Mark as New
- Bookmark
- Subscribe
- Mute
- RSS Feed
- Permalink
- Report Inappropriate Content
Given your example data what do you want the master dataset to look like after being modified?
- Mark as New
- Bookmark
- Subscribe
- Mute
- RSS Feed
- Permalink
- Report Inappropriate Content
Hi Arthur,
Thank you for taking a look at my question. I really appreciate your time for doing this.
After step 1, I want my master data to look like below. The purpose of step 1 is to reflect the store closure status (blank value) contained in the updated table to the master table.
So I am only reflecting blank value from the updated table because those are the days when stores were actually closed, and thus they should not have any sales in the master data table.
Based on updated sales data table, sales figures (under A, Nov13 & under B, Mar14) are replaced with blank/missing value.
However, please kindly note that none of the updated sales figures are transferred to the master table because their calculation method is different and I want to keep the original master sales figures.
Master sales data after running step 1 code
| Date | A | B | C |
|---|---|---|---|
| Jan-13 | 89 | ||
| Feb-13 | 19 | ||
| Mar-13 | 8 | ||
| Apr-13 | 73 | 57 | |
| May-13 | 38 | 76 | |
| Jun-13 | 33 | 55 | |
| Jul-13 | 67 | 4 | |
| Aug-13 | 33 | 65 | |
| Sep-13 | 91 | 15 | |
| Oct-13 | 30 | 35 | |
| Nov-13 | 45 | 3 | |
| Dec-13 | 100 | 89 | 12 |
| Jan-14 | 39 | 39 | 9 |
| Feb-14 | 100 | 92 | 65 |
| Mar-14 | 86 | 61 |
After step 2, the master data should look like below. The purpose of step 2 is to replace the first 3-month sales figures with blank value because initial sales periods are considered unstable.
After running step 2, the first 3-month data points are removed. Sales figures replaced with blanks are (Under A, Jan13,Feb13,Mar13; Under B, Apr13,May13,Jun13; Under C, Nov13,Dec13,Jan14).
Please also note that there are over 100 stores in the real data set not just A, B, C.
If am still being unclear, please kindly let me know.
Master sales data after running step 2 code
| Date | A | B | C |
|---|---|---|---|
| Jan-13 | |||
| Feb-13 | |||
| Mar-13 | |||
| Apr-13 | 73 | ||
| May-13 | 38 | ||
| Jun-13 | 33 | ||
| Jul-13 | 67 | 4 | |
| Aug-13 | 33 | 65 | |
| Sep-13 | 91 | 15 | |
| Oct-13 | 30 | 35 | |
| Nov-13 | 45 | ||
| Dec-13 | 100 | 89 | |
| Jan-14 | 39 | 39 | |
| Feb-14 | 100 | 92 | 65 |
| Mar-14 | 86 | 61 |
- Mark as New
- Bookmark
- Subscribe
- Mute
- RSS Feed
- Permalink
- Report Inappropriate Content
Are you saying that only missing values in update dataset are meaningful?
- Mark as New
- Bookmark
- Subscribe
- Mute
- RSS Feed
- Permalink
- Report Inappropriate Content
Hi PGStats,
Thank you for taking a look at my question, and yes, only missing values in updated dataset are meaningful because missing value represent days when stores were actually closed.
So I am trying to make the master dataset consistent with store closure (missing value) contained in the updated dataset.
In the updated dataset, calculation method to derive sales figures have changed, so I do not want to transfer new sales figures into the master dataset.
Thanks again for your kind help and please feel to let me know if any of my explanation is unclear.
- Mark as New
- Bookmark
- Subscribe
- Mute
- RSS Feed
- Permalink
- Report Inappropriate Content
Here is one way you could do it:
data temp;
set updated_sales;
array consistent A--C;
do over consistent;
if missing(consistent) then consistent=.A;
else call missing(consistent);
end;
run;
data master_sales;
missing a;
modify master_sales temp;
by date;
run;
- Mark as New
- Bookmark
- Subscribe
- Mute
- RSS Feed
- Permalink
- Report Inappropriate Content
Hi Arthur,
Thank you for your response! I ran your code, but I got a letter 'A' instead of missing value, so I added below codes at the end to replace all ‘A’ with missing value. This works perfectly for step 1. Thanks again for your help!!
data master;
set master;
array sales(*)_numeric_;
do i=1 to dim (sales);
if sales(i)='A' then sales(i)=' ';
end;
drop i;
- Mark as New
- Bookmark
- Subscribe
- Mute
- RSS Feed
- Permalink
- Report Inappropriate Content
The code didn`t replace your missing values with As but rather with .As .. which are quite valid SAS missing values.
- Mark as New
- Bookmark
- Subscribe
- Mute
- RSS Feed
- Permalink
- Report Inappropriate Content
Arthur, I see. I did not know .As are missing values in SAS. I'm still learning a lot about SAS, so please bear with me.
- Mark as New
- Bookmark
- Subscribe
- Mute
- RSS Feed
- Permalink
- Report Inappropriate Content
Hi, building on Art's clever idea, Here is the code for getting normal missing values everywhere you want them:
data master;
format date yymmd.;
infile datalines missover;
input D$ A B C;
date = input(cats("01-", D), date9.);
drop D;
datalines;
Jan-13 89
Feb-13 19
Mar-13 8
Apr-13 73 57
May-13 38 76
Jun-13 33 55
Jul-13 67 4
Aug-13 33 65
Sep-13 91 15
Oct-13 30 35
Nov-13 52 45 3
Dec-13 100 89 12
Jan-14 39 39 9
Feb-14 100 92 65
Mar-14 86 46 61
;
data updated;
format date yymmd.;
infile datalines missover;
input D$ A B C;
date = input(cats("01-", D), date9.);
drop D;
datalines;
Jan-13 80
Feb-13 80
Mar-13 80
Apr-13 80 57
May-13 80 76
Jun-13 33 55
Jul-13 67 4
Aug-13 33 65
Sep-13 91 15
Oct-13 30 35
Nov-13 . 45 3
Dec-13 100 89 12
Jan-14 39 39 9
Feb-14 100 92 65
Mar-14 86 . 61
;
/* Create a view from the update dataset where numerical sales are replaced with
normal missing values '.' which will be ignored in the update process and missing
sales are replaced with the special missing value '._' which will update the master
table sale to a normal missing value. */
data temp / view=temp;
set updated;
array sales A--C;
do i = 1 to dim(sales);
if missing(sales{i}) then sales{i}=._;
else call missing(sales{i});
end;
drop i;
run;
/* Update the master dataset */
data updatedMaster;
update master temp;
by date;
run;
/* Remove first three months of every store series */
/* Change the data structure to create proper time series */
proc transpose data=updatedMaster out=longMaster(where=(col1 is not missing));
by date;
run;
/* Change sales to missing for the first three months from each time series */
proc sql;
create table longMasterTrim as
select date, _name_,
case when date < intnx("MONTH", min(date), 3) then .
else COL1 end as sales
from longMaster
group by _name_
order by date, _name_;
quit;
/* Reorganize the time series horizontally */
proc transpose data=longMasterTrim out=wantedMaster(drop=_name_);
by date;
id _name_;
var sales;
run;
proc print data=wantedMaster noobs; run;
PG
- Mark as New
- Bookmark
- Subscribe
- Mute
- RSS Feed
- Permalink
- Report Inappropriate Content
Hi PGStats, this is exactly what I wanted and the code runs perfectly!! Thank you very much!!!
Arthur, stats@sas, and PGStats,
I really want to thank you again for all your generous help and I learned so much from all of you!
I’ve been thinking about how to run this program all this weekend… you have no idea how much I appreciate all of your guidance!!

- Mark as New
- Bookmark
- Subscribe
- Mute
- RSS Feed
- Permalink
- Report Inappropriate Content
Not sure about exact data structures of the mentioned tables, I tried in this way.
proc sql;
create table master_plus_updated as
select a.date,a.a,a.b,a.c,b.a as up_a,b.b as up_b,b.c as up_c
from master a inner join updated b
on a.date=b.date;
quit;
data final(drop=i up_a up_b up_c);
set master_plus_updated;
array master{*} a b c;
array updated{*} up_a up_b up_c;
do i=1 to dim(master);
if missing(updated{i}) then master{i}=updated{i};
if _n_<4 then master{i}=.;
end;
run;
proc print data=final;
run;
- Mark as New
- Bookmark
- Subscribe
- Mute
- RSS Feed
- Permalink
- Report Inappropriate Content
Hi stat@sas,
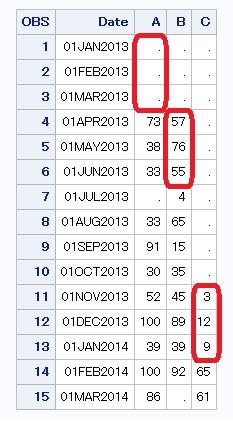
Thank you for taking a look at my question and it was very useful to learn how you coded step 2, removing the first 3-month sales from the table. I ran your code and it works perfectly if the sales figure started from the very first observation Jan2013. However, whenever sales figures do not start from the first row like B & C, it does not remove the first 3-month sales. Please look at the results of final dataset created. Red circled figures need to be replaced with blank. I tried to experiment with other condition/functions, but I am still unable to figure out how to make it work for B & C…

- Mark as New
- Bookmark
- Subscribe
- Mute
- RSS Feed
- Permalink
- Report Inappropriate Content
Here is Hash Table version code . Hope it would be faster than PG. ![]()
If I know how many stores you have, that would be easier.
data master;
format date yymmd.;
infile datalines missover;
input D$ A B C;
date = input(cats("01-", D), date9.);
drop D;
datalines;
Jan-13 89
Feb-13 19
Mar-13 8
Apr-13 73 57
May-13 38 76
Jun-13 33 55
Jul-13 67 4
Aug-13 33 65
Sep-13 91 15
Oct-13 30 35
Nov-13 52 45 3
Dec-13 100 89 12
Jan-14 39 39 9
Feb-14 100 92 65
Mar-14 86 46 61
;
data updated;
format date yymmd.;
infile datalines missover;
input D$ A B C;
date = input(cats("01-", D), date9.);
drop D;
datalines;
Jan-13 80
Feb-13 80
Mar-13 80
Apr-13 80 57
May-13 80 76
Jun-13 33 55
Jul-13 67 4
Aug-13 33 65
Sep-13 91 15
Oct-13 30 35
Nov-13 . 45 3
Dec-13 100 89 12
Jan-14 39 39 9
Feb-14 100 92 65
Mar-14 86 . 61
;
run;
data temp;
 set master;
 length vname $ 40;
 array _x{*} a--c ;
 do i=1 to dim(_x);
  if not missing(_x{i}) then do;vname=vname(_x{i});output;end;
 end;
 keep date vname;
run;
proc sort data=temp;by  vname;run;
data map;
 set temp;
 by vname;
 if first.vname then n=0;
 n+1;
 if n le 3 then output;
 drop n;
run;
data map1;
 set updated;
 length vname $ 40;
 array _x{*} a--c ;
 do i=1 to dim(_x);
  if missing(_x{i}) and not missing(lag(_x{i})) then do;vname=vname(_x{i});output;end;
 end;
 keep date vname;
run;
proc append base=map data=map1 force;run;
data want;
 if _n_ eq 1 then do;
  if 0 then set map;
  declare hash h(dataset:'map');
   h.definekey('date','vname');
   h.definedone();
 end;
 set master;
 length vname $ 40;
 array _x{*} a--c ;
 do i=1 to dim(_x);
  vname=vname(_x{i});
  if h.check()=0 then call missing(_x{i});
 end;
 drop i vname;
run;
Xia Keshan
- Mark as New
- Bookmark
- Subscribe
- Mute
- RSS Feed
- Permalink
- Report Inappropriate Content
Hi Xia,
Thank you for your response! I ran your codes and it runs beautifully!!
The number of stores changes from time to time, so I am very happy with your codes because I only need to update an array function when I retrieve the sales data.
I really learn a lot from all of you, so thanks again!
Best,
Hatsumi
.jpg")
Catch up on SAS Innovate 2026
Nearly 200 sessions are now available on demand with the SAS Innovate Digital Pass.
Explore Now →Learn the difference between classical and Bayesian statistical approaches and see a few PROC examples to perform Bayesian analysis in this video.

Find more tutorials on the SAS Users YouTube channel.
SAS Training: Just a Click Away
Ready to level-up your skills? Choose your own adventure.
-
14 replies
-
05-10-2014 04:53 PM
-
10548 views
-
11 likes
-
5 in conversation
-
