- Home
- /
- Programming
- /
- SAS Procedures
- /
- Re: Sum
- RSS Feed
- Mark Topic as New
- Mark Topic as Read
- Float this Topic for Current User
- Bookmark
- Subscribe
- Mute
- Printer Friendly Page

- Mark as New
- Bookmark
- Subscribe
- Mute
- RSS Feed
- Permalink
- Report Inappropriate Content
Hi-
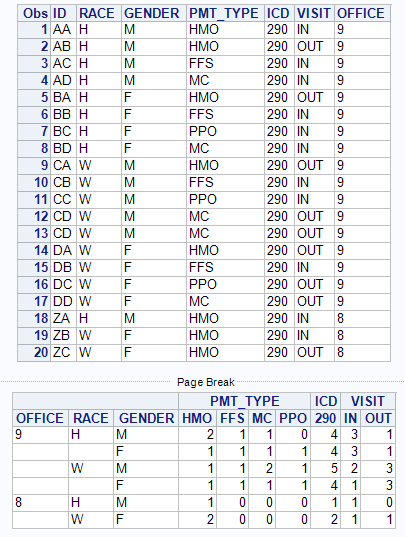
I am trying to add individual records and roll up to office, regional and state levels. I was producing multiple table frequencies but the totals are appearing on the right hand side when I am wanting the totals to be within the table. My data looks like this and I've also included my desired results. The regional level rows are the sums of individual office levels. Any help would be appreciated. Thank you.
| ID | RACE | GENDER | PMT_TYPE | ICD | VISIT | OFFICE |
| AA | H | M | HMO | 290 | IN | 9 |
| AB | H | M | HMO | 290 | OUT | 9 |
| AC | H | M | FFS | 290 | IN | 9 |
| AD | H | M | MC | 290 | IN | 9 |
| BA | H | F | HMO | 290 | OUT | 9 |
| BB | H | F | FFS | 290 | IN | 9 |
| BC | H | F | PPO | 290 | IN | 9 |
| BD | H | F | MC | 290 | IN | 9 |
| CA | W | M | HMO | 290 | OUT | 9 |
| CB | W | M | FFS | 290 | IN | 9 |
| CC | W | M | PPO | 290 | IN | 9 |
| CD | W | M | MC | 290 | OUT | 9 |
| CD | W | M | MC | 290 | OUT | 9 |
| DA | W | F | HMO | 290 | OUT | 9 |
| DB | W | F | FFS | 290 | IN | 9 |
| DC | W | F | PPO | 290 | OUT | 9 |
| DD | W | F | MC | 290 | OUT | 9 |
| ZA | H | M | HMO | 290 | IN | 8 |
| ZB | W | F | HMO | 290 | IN | 8 |
| ZC | W | F | HMO | 290 | OUT | 8 |
| Desired output: | |||||||||
| LEVEL | RACE | GENDER | HMO | FFS | PPO | MC | ICD290 | IN-VISIT | OUT-VISIT |
| OFFICE9 | H | M | 2 | 1 | 0 | 1 | 4 | 2 | 1 |
| OFFICE9 | H | F | 1 | 1 | 1 | 1 | 4 | 3 | 1 |
| OFFICE9 | W | M | 1 | 1 | 1 | 2 | 5 | 2 | 3 |
| OFFICE9 | W | F | 1 | 1 | 1 | 1 | 4 | 1 | 3 |
| OFFICE8 | W | F | 1 | 0 | 0 | 0 | 1 | 1 | 0 |
| OFFICE8 | W | F | 1 | 0 | 0 | 0 | 1 | 0 | 1 |
| REGION | H | M | 2 | 1 | 0 | 1 | 4 | 2 | 1 |
| REGION | H | F | 1 | 1 | 1 | 1 | 4 | 3 | 1 |
| REGION | W | M | 1 | 1 | 1 | 2 | 5 | 2 | 3 |
| REGION | W | F | 3 | 1 | 1 | 1 | 6 | 2 | 4 |
Accepted Solutions

- Mark as New
- Bookmark
- Subscribe
- Mute
- RSS Feed
- Permalink
- Report Inappropriate Content
try this:
data have;
input ID $ RACE $ GENDER $ PMT_TYPE $ ICD $ VISIT $ OFFICE $;
office=cats('OFFICE',office);
cards;
AA H M HMO 290 IN 9
AB H M HMO 290 OUT 9
AC H M FFS 290 IN 9
AD H M MC 290 IN 9
BA H F HMO 290 OUT 9
BB H F FFS 290 IN 9
BC H F PPO 290 IN 9
BD H F MC 290 IN 9
CA W M HMO 290 OUT 9
CB W M FFS 290 IN 9
CC W M PPO 290 IN 9
CD W M MC 290 OUT 9
CD W M MC 290 OUT 9
DA W F HMO 290 OUT 9
DB W F FFS 290 IN 9
DC W F PPO 290 OUT 9
DD W F MC 290 OUT 9
ZA H M HMO 290 IN 8
ZB W F HMO 290 IN 8
ZC W F HMO 290 OUT 8
;
run;
options missing=0;
proc freq data=have noprint;
tables office*race*gender*pmt_type / out=freq_pmt nopercent;
tables office*race*gender*icd / out=freq_icd nopercent;
tables office*race*gender*visit / out=freq_visit nopercent;
run;
proc transpose data=freq_pmt out=trans_pmt(drop=_name_ _Label_);
by office race gender;
id pmt_type;
var count;
run;
proc transpose data=freq_icd out=trans_icd(drop=_name_ _Label_) prefix=ICD;
by office race gender;
id icd;
var count;
run;
proc transpose data=freq_visit out=trans_visit(drop=_name_ _Label_) suffix=_VISIT;
by office race gender;
id visit;
var count;
run;
data want;
merge trans_pmt trans_icd trans_visit;
by office race gender;
run;
CTorres

- Mark as New
- Bookmark
- Subscribe
- Mute
- RSS Feed
- Permalink
- Report Inappropriate Content
This is close.
infile cards expandtabs;
input (ID RACE GENDER PMT_TYPE ICD VISIT OFFICE)($);
cards;
AA H M HMO 290 IN 9
AB H M HMO 290 OUT 9
AC H M FFS 290 IN 9
AD H M MC 290 IN 9
BA H F HMO 290 OUT 9
BB H F FFS 290 IN 9
BC H F PPO 290 IN 9
BD H F MC 290 IN 9
CA W M HMO 290 OUT 9
CB W M FFS 290 IN 9
CC W M PPO 290 IN 9
CD W M MC 290 OUT 9
CD W M MC 290 OUT 9
DA W F HMO 290 OUT 9
DB W F FFS 290 IN 9
DC W F PPO 290 OUT 9
DD W F MC 290 OUT 9
ZA H M HMO 290 IN 8
ZB W F HMO 290 IN 8
ZC W F HMO 290 OUT 8
;;;;
run;
proc print;
run;
options missing=0;
proc report nowd list;
columns office race gender pmt_type icd visit;
define office / group descending;
define race / group;
define gender / group descending;
define pmt_type / across order=data;
define icd / across;
define visit / across;
run;
- Mark as New
- Bookmark
- Subscribe
- Mute
- RSS Feed
- Permalink
- Report Inappropriate Content
try this:
data have;
input ID $ RACE $ GENDER $ PMT_TYPE $ ICD $ VISIT $ OFFICE $;
office=cats('OFFICE',office);
cards;
AA H M HMO 290 IN 9
AB H M HMO 290 OUT 9
AC H M FFS 290 IN 9
AD H M MC 290 IN 9
BA H F HMO 290 OUT 9
BB H F FFS 290 IN 9
BC H F PPO 290 IN 9
BD H F MC 290 IN 9
CA W M HMO 290 OUT 9
CB W M FFS 290 IN 9
CC W M PPO 290 IN 9
CD W M MC 290 OUT 9
CD W M MC 290 OUT 9
DA W F HMO 290 OUT 9
DB W F FFS 290 IN 9
DC W F PPO 290 OUT 9
DD W F MC 290 OUT 9
ZA H M HMO 290 IN 8
ZB W F HMO 290 IN 8
ZC W F HMO 290 OUT 8
;
run;
options missing=0;
proc freq data=have noprint;
tables office*race*gender*pmt_type / out=freq_pmt nopercent;
tables office*race*gender*icd / out=freq_icd nopercent;
tables office*race*gender*visit / out=freq_visit nopercent;
run;
proc transpose data=freq_pmt out=trans_pmt(drop=_name_ _Label_);
by office race gender;
id pmt_type;
var count;
run;
proc transpose data=freq_icd out=trans_icd(drop=_name_ _Label_) prefix=ICD;
by office race gender;
id icd;
var count;
run;
proc transpose data=freq_visit out=trans_visit(drop=_name_ _Label_) suffix=_VISIT;
by office race gender;
id visit;
var count;
run;
data want;
merge trans_pmt trans_icd trans_visit;
by office race gender;
run;
CTorres
- Mark as New
- Bookmark
- Subscribe
- Mute
- RSS Feed
- Permalink
- Report Inappropriate Content
thank you very much. This produced a much closer output I was looking for. Thank you!!!

- Mark as New
- Bookmark
- Subscribe
- Mute
- RSS Feed
- Permalink
- Report Inappropriate Content
A solution is the following:
proc sql;
select distinct 'SUM(pmt_type='||''''||strip(pmt_type)||''''||') as '||pmt_type into :p_type separated by ',' from have;
select distinct 'SUM(ICD='||''''||strip(ICD)||''''||') as '||COMPRESS('ICD'||ICD) into :i_type separated by ',' from have;
select distinct 'SUM(VISIT='||''''||strip(VISIT)||''''||') as '||COMPRESS(''''||VISIT||'-VISIT''n') into :v_type separated by ',' from have;
create table want(rename=(off=office)) as
select compress('Office'||put(office,2.)) as off, race, gender,
&p_type , &i_type , &v_type
from have
group by office, race, gender
order by office desc, race, gender desc;
create table want2 as
select 'REGION' as office, race, gender,
&p_type , &i_type , &v_type
from have
group by race, gender
order by race, gender desc;
insert into want select * from want2;
drop table want2;
quit;

- Mark as New
- Bookmark
- Subscribe
- Mute
- RSS Feed
- Permalink
- Report Inappropriate Content
SQL can give you less code and faster speed . I am about to make a paper about this when you are building a report .
data office;
   infile cards expandtabs;
   input (ID  RACE  GENDER   PMT_TYPE ICD   VISIT OFFICE)($);
   cards;
AA H  M  HMO   290   IN 9
AB H  M  HMO   290   OUT   9
AC H  M  FFS   290   IN 9
AD H  M  MC 290   IN 9
BA H  F  HMO   290   OUT   9
BB H  F  FFS   290   IN 9
BC H  F  PPO   290   IN 9
BD H  F  MC 290   IN 9
CA W  M  HMO   290   OUT   9
CB W  M  FFS   290   IN 9
CC W  M  PPO   290   IN 9
CD W  M  MC 290   OUT   9
CD W  M  MC 290   OUT   9
DA W  F  HMO   290   OUT   9
DB W  F  FFS   290   IN 9
DC W  F  PPO   290   OUT   9
DD W  F  MC 290   OUT   9
ZA H  M  HMO   290   IN 8
ZB W  F  HMO   290   IN 8
ZC W  F  HMO   290   OUT   8
;;;;
   run;

proc sql;
 create table temp as
  select office,race,gender,PMT_TYPE as type ,count(*) as n
   from office
    group by office,race,gender,PMT_TYPE
 union
  select office,race,gender,ICD as type ,count(*) as n
   from office
    group by office,race,gender,ICD
 union
  select office,race,gender,VISIT as type ,count(*) as n
   from office
    group by office,race,gender,VISIT ;
quit;
proc transpose data=temp out=temp1(drop=_:);
 by  office race gender     ;
 id type;
 var n;
run;
proc stdize data=temp1 out=want missing=0 reponly;run;
Xia Keshan
.jpg")
Catch up on SAS Innovate 2026
Nearly 200 sessions are now available on demand in the Innovate Hub.
Watch Now →Learn the difference between classical and Bayesian statistical approaches and see a few PROC examples to perform Bayesian analysis in this video.

Find more tutorials on the SAS Users YouTube channel.
SAS Training: Just a Click Away
Ready to level-up your skills? Choose your own adventure.
-
5 replies
-
12-19-2014 01:08 PM
-
3340 views
-
3 likes
-
5 in conversation
-
