- Home
- /
- Programming
- /
- SAS Procedures
- /
- Stored Process code to create spark Table
- RSS Feed
- Mark Topic as New
- Mark Topic as Read
- Float this Topic for Current User
- Bookmark
- Subscribe
- Mute
- Printer Friendly Page

- Mark as New
- Bookmark
- Subscribe
- Mute
- RSS Feed
- Permalink
- Report Inappropriate Content
Hi All,
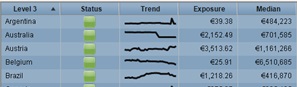
I am having requirement to create spark table using base SAS. I am aware of creating spark line graph using sgplot, but I don need that as I have the requiremnt to create speakline in a table, as I need to show some varibales in the table with sparkline. Please find the screenshot of the expected output below:-
Regards,
Swapna

- Mark as New
- Bookmark
- Subscribe
- Mute
- RSS Feed
- Permalink
- Report Inappropriate Content
Hi:
The general approach to this is to make the separate image files for each country or category. But then. you use a style override in PROC PRINT or PROC REPORT to insert the image into the table.
See these papers by Paul Oldenkamp http://www2.sas.com/proceedings/forum2008/262-2008.pdf and
Louise Hadden and her example http://support.sas.com/resources/papers/proceedings13/212-2013.pdf of a graph in a table on page 9.
I recommend that you get the program working first before you turn this into a stored process.
.cynthia

- Mark as New
- Bookmark
- Subscribe
- Mute
- RSS Feed
- Permalink
- Report Inappropriate Content
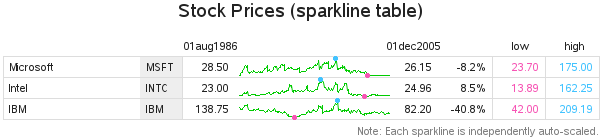
I describe one way to do this in my book "SAS/Graph: Beyond the Basics" (Example 14).
Here is the code used in that example:
http://robslink.com/SAS/book/example14.sas
And here is an example of what the output looks like:

Available on demand!
Missed SAS Innovate Las Vegas? Watch all the action for free! View the keynotes, general sessions and 22 breakouts on demand.
Learn the difference between classical and Bayesian statistical approaches and see a few PROC examples to perform Bayesian analysis in this video.

Find more tutorials on the SAS Users YouTube channel.
 Click image to register for webinar
Classroom Training Available!
Select SAS Training centers are offering in-person courses. View upcoming courses for:
-
2 replies
-
06-18-2015 08:09 AM
-
969 views
-
0 likes
-
3 in conversation
-
