- Home
- /
- Programming
- /
- SAS Procedures
- /
- Re: Proc Report - skip 1 line between group breaks?
- RSS Feed
- Mark Topic as New
- Mark Topic as Read
- Float this Topic for Current User
- Bookmark
- Subscribe
- Mute
- Printer Friendly Page
- Mark as New
- Bookmark
- Subscribe
- Mute
- RSS Feed
- Permalink
- Report Inappropriate Content
I would like Proc Report to create an xml file using ExcelXP tagset with 1 blank row beween the subgroups in a Proc Report.
I have used this compute block successfully with html files, but not with xml. With xml is creates TWO blank rows instead of one.
Compute after poGRoup;
line '';
endComp;
I am using windows SAS 9.2 and Excel 2007.
Any advice is appreciated.
- Mark as New
- Bookmark
- Subscribe
- Mute
- RSS Feed
- Permalink
- Report Inappropriate Content
Instead try:
break after poGRoup / page ;
- Mark as New
- Bookmark
- Subscribe
- Mute
- RSS Feed
- Permalink
- Report Inappropriate Content
Thanks, but that creates a worksheet for each subgroup. Here is full code that replicates the issue using SAShelp.shoes.
Options missing=0;
ODS Listing close;
ods tagsets.ExcelXP file="M:\_a_Test_Grp.xml" style=SEASIDE
options(embedded_titles='yes' embedded_footnotes='yes'
index = 'yes'
/*doc='Help' */
);
ods tagsets.excelxp options(sheet_name="By region") ;
title4 'By region';
proc report data= sashelp.shoes
nowd split='*'
style(report)= [FONT_FACE='Calibri' cellspacing=0 rules=groups
borderwidth=1 bordercolor=blue]
STYLE(Header)= [FONT_FACE='Calibri' fontweight=bold]
STYLE(Summary)= [FONT_FACE='Calibri' fontweight=bold]
;
column region sales
;
define region / group;
define sales / analysis sum Format=comma9.
style=[tagattr="format:#,##0"];
rBreak after / summarize ;
Break AFTER region / summarize ;
Compute after region /
style={foreground=white background=white
cellheight=1px font_size=1px};
line '';
endComp;
Compute after ;
region = 'Grand Total';
endComp;
run;
ods tagsets.ExcelXP close;
ods listing;
Removing the Compute block for the blank line gives no rows between groups.
- Mark as New
- Bookmark
- Subscribe
- Mute
- RSS Feed
- Permalink
- Report Inappropriate Content
Put sheet_interval='none' into your options ie:
ods tagsets.excelxp options(sheet_name="By region"
sheet_interval='none') ;
and then use previous tip: break after poGRoup / page ;
- Mark as New
- Bookmark
- Subscribe
- Mute
- RSS Feed
- Permalink
- Report Inappropriate Content
thanks again. Did not solve the problem for me. Does this work on your system? Maybe the problem has something to do with Excel 2007.
- Mark as New
- Bookmark
- Subscribe
- Mute
- RSS Feed
- Permalink
- Report Inappropriate Content
Shouldn't do. Do you have an order on your define statement for poGRoup?
eg: define poGRoup / order ;
You might have to post your full code as this works perfectly well for code I have
- Mark as New
- Bookmark
- Subscribe
- Mute
- RSS Feed
- Permalink
- Report Inappropriate Content
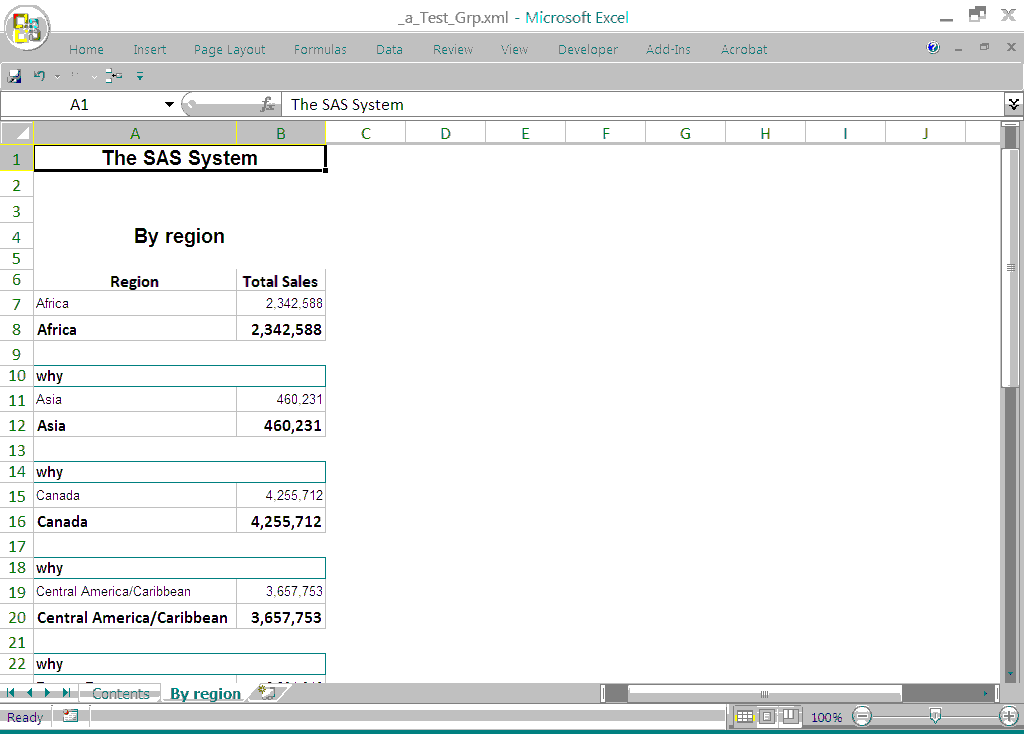
 Actually - full code is posted above. Here is a screen print of what my output looks like in Excel:
NOTE - I placed 'why' text in the Line statement to help differentiate between the 2 lines. One line is totally blank and the other has a border around it.
Thanks again.
- Mark as New
- Bookmark
- Subscribe
- Mute
- RSS Feed
- Permalink
- Report Inappropriate Content
Try:
options papersize = A4 ;
ods tagsets.excelxp file="M:\_a_Test_Grp.xml"
options (Sheet_Name = 'By Region'
sheet_interval='none'
Orientation = 'landscape'
Frozen_Headers = '1')
style = minimal ;
proc report data = sashelp.shoes nowd
style(header)=[background = #99CCFF
font_size=11pt
just = l]
style(column)=[font_size=10pt
just = left] ;
column region sales ;
define region / 'Region' group ;
define sales / 'Sales' analysis sum ;
rbreak after / summarize ;
break after region / summarize ;
break after region / page ;
compute after ;
region = 'Grand Total';
endcomp;
run ;
ods tagsets.excelxp close;
- Mark as New
- Bookmark
- Subscribe
- Mute
- RSS Feed
- Permalink
- Report Inappropriate Content
Thanks. That code does achieve the single row between groups. Sadly, It does lose the other features which I need, such as the index and the embedded titles. I could only get this exact code to work ( and I really dont understands why it does work ). Any other modification cause the doubling of rows. It is interesting. I will call this as a solution, since it's good enough.
- Mark as New
- Bookmark
- Subscribe
- Mute
- RSS Feed
- Permalink
- Report Inappropriate Content
You can put all bar the index into the one set of options and flag the top set in your code above ie:
options (Sheet_Name = 'By Region'
sheet_interval='none'
embedded_titles='yes'
embedded_footnotes='yes')
The index you are trying to use only works on worksheets in the ExcelXP tagset. If you want to do this instead ie one output per worksheet then the index can go in the options above, it doesn't need a separate one.
Learn the difference between classical and Bayesian statistical approaches and see a few PROC examples to perform Bayesian analysis in this video.
Find more tutorials on the SAS Users YouTube channel.
SAS Training: Just a Click Away
Ready to level-up your skills? Choose your own adventure.


