- Home
- /
- Programming
- /
- SAS Procedures
- /
- Re: Proc Freq: How to order row values differently from column values?
- RSS Feed
- Mark Topic as New
- Mark Topic as Read
- Float this Topic for Current User
- Bookmark
- Subscribe
- Mute
- Printer Friendly Page

- Mark as New
- Bookmark
- Subscribe
- Mute
- RSS Feed
- Permalink
- Report Inappropriate Content
My usual mantra is: Anything Excel can do, SAS can do better. But now I'm not so sure. I haven't been able to figure out how to get Proc Freq
to order the rows by frequency while leaving the columns in alphabetical order. Does anyone know how to do this? Sample data and code shown
below. Thanks in advance for any ideas you can suggest.
data ElementarySchoolRegistration;
input id school $10.year;
datalines;
1 Washington 2012
2 Washington 2012
3 Washington 2013
4 Washington 2014
5 Washington 2014
6 Washington 2014
7 Jefferson 2012
8 Jefferson 2012
9 Jefferson 2013
10 Jefferson 2014
11 Lincoln 2013
12 Lincoln 2014
13 Lincoln 2014
;
run;
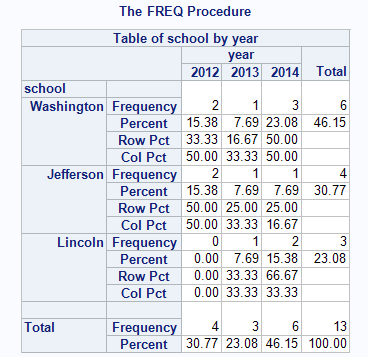
* Values of row and column variables ordered alphabetically *;
proc freq data=ElementarySchoolRegistration;
tables school*year;
run;
* Values of row and column variables ordered by frequency *;
proc freq data=ElementarySchoolRegistration order=freq;
tables school*year;
run;
* Would like rows ordered by frequency and columns ordered alphabetically *;
* How does one achieve that? *;
Accepted Solutions

- Mark as New
- Bookmark
- Subscribe
- Mute
- RSS Feed
- Permalink
- Report Inappropriate Content
class school / order=freq;
class year / order=internal;
output out=counts;
run;
proc freq order=data;
tables school*year;
weight _freq_;
run;
- Mark as New
- Bookmark
- Subscribe
- Mute
- RSS Feed
- Permalink
- Report Inappropriate Content
class school / order=freq;
class year / order=internal;
output out=counts;
run;
proc freq order=data;
tables school*year;
weight _freq_;
run;
- Mark as New
- Bookmark
- Subscribe
- Mute
- RSS Feed
- Permalink
- Report Inappropriate Content
Data_Null_, this works great! Thank you so much.
P.S. I ended up adding one small step to your clever code to get rid of the subtotal records in the counts dataset (because the subtotals were creating extra missing values in the freq step). But now it's just right. Thanks again.
proc summary data=ElementarySchoolRegistration;
class school / order=freq;
class year / order=internal;
output out=counts;
run;
data countswosubtotals;
set counts;
where school ne '' AND year ne .;
run;
proc freq data=countswosubtotals order=data;
tables school*year;
weight _freq_;
run;

- Mark as New
- Bookmark
- Subscribe
- Mute
- RSS Feed
- Permalink
- Report Inappropriate Content
Why did you remove the nway option from proc summary? It did just that - removed the subtotals.
- Mark as New
- Bookmark
- Subscribe
- Mute
- RSS Feed
- Permalink
- Report Inappropriate Content
You're right, Vladislaff. The omission was accidental. Using nway is certainly a better way to get rid of the subtotals. Thanks for pointing that out. I'm learning so much from you all.

- Mark as New
- Bookmark
- Subscribe
- Mute
- RSS Feed
- Permalink
- Report Inappropriate Content
Just for your data . simply add order=data is OK.
data ElementarySchoolRegistration;
input id school $10.year;
datalines;
1 Washington 2012
2 Washington 2012
3 Washington 2013
4 Washington 2014
5 Washington 2014
6 Washington 2014
7 Jefferson  2012
8 Jefferson  2012
9 Jefferson  2013
10 Jefferson 2014
11 Lincoln   2013
12 Lincoln   2014
13 Lincoln   2014
;
run;

* Values of row and column variables ordered alphabetically *;
proc freq data=ElementarySchoolRegistration order=data;
tables school*year;
run;
Xia Keshan
- Mark as New
- Bookmark
- Subscribe
- Mute
- RSS Feed
- Permalink
- Report Inappropriate Content
If you don't know who has the maximize freq , try this one :
proc sql;
create table temp as
select *,count(*) as count from ElementarySchoolRegistration
group by school
order by count descending,year;
quit;
* Values of row and column variables ordered alphabetically *;
proc freq data=temp order=data;
tables school*year;
run;
Xia Keshan
- Mark as New
- Bookmark
- Subscribe
- Mute
- RSS Feed
- Permalink
- Report Inappropriate Content
Thanks for the suggestion, Ksharp. BTW I'm trying to mark the great answers I've received as correct or helpful so that the original question will be marked answered; however, I'm not seeing the icons to click. Is there something I have to do, beyond logging in, to get the correct/helpful icons to show up?
- Mark as New
- Bookmark
- Subscribe
- Mute
- RSS Feed
- Permalink
- Report Inappropriate Content
Ou. That doesn't matter to mark whose answer is correct . as long as you got a solution.
And you don't need to do anything more. It seems that sometime the validated limitation is a couple of hours, once you are out of this range ,You will not find the CORRECT button any more .
Xia Keshan
.jpg")
Catch up on SAS Innovate 2026
Nearly 200 sessions are now available on demand with the SAS Innovate Digital Pass.
Explore Now →Learn the difference between classical and Bayesian statistical approaches and see a few PROC examples to perform Bayesian analysis in this video.

Find more tutorials on the SAS Users YouTube channel.
SAS Training: Just a Click Away
Ready to level-up your skills? Choose your own adventure.
-
8 replies
-
10-15-2014 04:07 PM
-
7426 views
-
10 likes
-
4 in conversation
-
