- Home
- /
- Programming
- /
- SAS Procedures
- /
- Re: PROC REPORT summary report help
- RSS Feed
- Mark Topic as New
- Mark Topic as Read
- Float this Topic for Current User
- Bookmark
- Subscribe
- Mute
- Printer Friendly Page

- Mark as New
- Bookmark
- Subscribe
- Mute
- RSS Feed
- Permalink
- Report Inappropriate Content
Dear All,
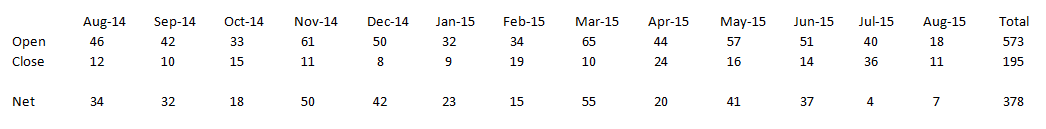
I hope you will be able to help me in getting the desired result. I am currently working on a specific requirement to generate the below report:

However, when I tried to generate the same, I could able to generate the report in the below format:
STATUS TOTAL 14M08 14M09 14M10 14M11 14M12 15M01 15M02 15M03
-------------------------------------------------------------------------
CLOSE 199 12 10 15 11 8 9 19 10
OPEN 583 46 42 33 61 50 32 34 65 ……. Till the Aug-15.
Now, I got stuck while addressing the below requirements:
- Displaying totals on the right most side.
- Displaying the net differences at the end of the report.
- Covert the MONTH-YEAR format YYMM as 'MMM-YY' .
I tried several options but unable to get any idea to move forward. My knowledge to SAS is limited and I am in the process of enhancing it.
The sample input data file look like this:
OPEN_ MNTH_
Obs CLOSE_ST MNTH_YM CNT_OPCL
1 OPEN 14M08 1
2 OPEN 14M08 1
3 OPEN 14M09 1
4 OPEN 14M09 1
5 OPEN 14M10 1
6 OPEN 14M10 1
7 CLOSE 14M08 1
8 CLOSE 14M08 1
9 CLOSE 14M09 1
10 CLOSE 14M09 1
11 CLOSE 14M10 1
12 CLOSE 14M10 1
Please help me in this regards to be able to generate the report.
Regards,
Prasad.
Accepted Solutions

- Mark as New
- Bookmark
- Subscribe
- Mute
- RSS Feed
- Permalink
- Report Inappropriate Content
Ou. That make problem a bit more complicated . I think it is hard for proc report and proc tabulate , and you need some data step help.
data have;
input  Obs CLOSE_ST $   OPEN_MNTH_YM  $  MNTH_CNT_OPCL;
date=input(compress(OPEN_MNTH_YM,,'kd'),yymmn.);
cards;
1 OPEN 14M08 2
2 OPEN 14M08 1
3 OPEN 14M09 1
4 OPEN 14M09 1
5 OPEN 14M10 1
6 OPEN 14M10 1
7 CLOSE 14M08 1
8 CLOSE 14M08 1
9 CLOSE 14M09 1
10 CLOSE 14M09 1
11 CLOSE 14M10 1
12 CLOSE 14M10 1
;
run;
proc format;
picture fmt
 other='%b-%0y' (datatype=date);
run;
proc summary data=have nway;
 class  date CLOSE_ST;
 format date fmt8.;
 var MNTH_CNT_OPCL;
 output out=temp(drop=_type_ _freq_) sum=;
run;
data temp1;
 set temp;
 by date;
 if CLOSE_ST='OPEN' then group=1;
  else if CLOSE_ST='CLOSE' then group=2;
 output;
 dif=dif(MNTH_CNT_OPCL);
 if last.date then do;
  CLOSE_ST='Net';MNTH_CNT_OPCL=dif;group=3;output;
 end;
 drop dif;
run;
proc sort data=temp1;by group;run;
proc tabulate data=temp1 order=data;
class CLOSE_ST date;
var MNTH_CNT_OPCL;
table CLOSE_ST=' ',(date=' ' all='Total')*MNTH_CNT_OPCL=' '*sum=' '*f=best8.;
run;
消息编辑者为:xia keshan
消息编辑者为:xia keshan
- Mark as New
- Bookmark
- Subscribe
- Mute
- RSS Feed
- Permalink
- Report Inappropriate Content
Code: Program
data have;
input  Obs CLOSE_ST $   OPEN_MNTH_YM  $  MNTH_CNT_OPCL;
date=input(compress(OPEN_MNTH_YM,,'kd'),yymmn.);
format date monyy.;
cards;
  1 OPEN 14M08 1
  2 OPEN 14M08 1
  3 OPEN 14M09 1
  4 OPEN 14M09 1
  5 OPEN 14M10 1
  6 OPEN 14M10 1
  7 CLOSE 14M08 1
  8 CLOSE 14M08 1
  9 CLOSE 14M09 1
  10 CLOSE 14M09 1
  11 CLOSE 14M10 1
  12 CLOSE 14M10 1
;
run;
proc tabulate data=have;
class CLOSE_ST date;
format date monyy.;
var MNTH_CNT_OPCL;
table CLOSE_ST=' ',(date=' ' all='Total')*MNTH_CNT_OPCL=' '*sum=' '*f=best8.;
run;
- Mark as New
- Bookmark
- Subscribe
- Mute
- RSS Feed
- Permalink
- Report Inappropriate Content
Hi Xia..Thank you so much for your quick response. I do get the desired result, except the net differences at the end as shown in the report.
I am not sure whether I can use COMPUTE statement or something else.
Regards,
Prasad.
- Mark as New
- Bookmark
- Subscribe
- Mute
- RSS Feed
- Permalink
- Report Inappropriate Content
Ou. That make problem a bit more complicated . I think it is hard for proc report and proc tabulate , and you need some data step help.
data have;
input  Obs CLOSE_ST $   OPEN_MNTH_YM  $  MNTH_CNT_OPCL;
date=input(compress(OPEN_MNTH_YM,,'kd'),yymmn.);
cards;
1 OPEN 14M08 2
2 OPEN 14M08 1
3 OPEN 14M09 1
4 OPEN 14M09 1
5 OPEN 14M10 1
6 OPEN 14M10 1
7 CLOSE 14M08 1
8 CLOSE 14M08 1
9 CLOSE 14M09 1
10 CLOSE 14M09 1
11 CLOSE 14M10 1
12 CLOSE 14M10 1
;
run;
proc format;
picture fmt
 other='%b-%0y' (datatype=date);
run;
proc summary data=have nway;
 class  date CLOSE_ST;
 format date fmt8.;
 var MNTH_CNT_OPCL;
 output out=temp(drop=_type_ _freq_) sum=;
run;
data temp1;
 set temp;
 by date;
 if CLOSE_ST='OPEN' then group=1;
  else if CLOSE_ST='CLOSE' then group=2;
 output;
 dif=dif(MNTH_CNT_OPCL);
 if last.date then do;
  CLOSE_ST='Net';MNTH_CNT_OPCL=dif;group=3;output;
 end;
 drop dif;
run;
proc sort data=temp1;by group;run;
proc tabulate data=temp1 order=data;
class CLOSE_ST date;
var MNTH_CNT_OPCL;
table CLOSE_ST=' ',(date=' ' all='Total')*MNTH_CNT_OPCL=' '*sum=' '*f=best8.;
run;
消息编辑者为:xia keshan
消息编辑者为:xia keshan
- Mark as New
- Bookmark
- Subscribe
- Mute
- RSS Feed
- Permalink
- Report Inappropriate Content
Thank you very much XIA. This worked exactly the way I was expecting. Very much appreciated for your help.
Prasad.
.jpg")
Catch up on SAS Innovate 2026
Nearly 200 sessions are now available on demand with the SAS Innovate Digital Pass.
Explore Now →Learn the difference between classical and Bayesian statistical approaches and see a few PROC examples to perform Bayesian analysis in this video.

Find more tutorials on the SAS Users YouTube channel.
SAS Training: Just a Click Away
Ready to level-up your skills? Choose your own adventure.
-
4 replies
-
08-25-2015 09:26 PM
-
2376 views
-
1 like
-
2 in conversation
-
