- Home
- /
- Programming
- /
- SAS Procedures
- /
- Re: Need help on proc transpose
- RSS Feed
- Mark Topic as New
- Mark Topic as Read
- Float this Topic for Current User
- Bookmark
- Subscribe
- Mute
- Printer Friendly Page

- Mark as New
- Bookmark
- Subscribe
- Mute
- RSS Feed
- Permalink
- Report Inappropriate Content
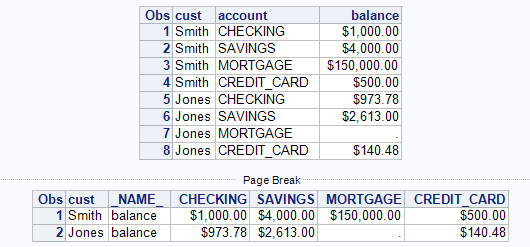
I need help on proc tranpose. My data is as below.
cust account balance
Smith checking $1,000.00
Smith Savings $4,000.00
Smith mortgage $150,000.00
Smith credit_card $500.00
Jones checking $973.78
Jones savings $2,613
Jones Mortgage .
Jones credit_card $140.48
I need to convert as below. I did tried, but trouble displaying the varaibles as below.So I request someone to suggest me here.
cust checking saving mortgage credit_card
smith $1,000.00 $4,000.00 $150,000.00 $500.00
Jones $973.78 $2,613 . $140.48
On a seperate note, I need to find a correlation between each account (between checking and saving, mortgage and credit card etc) to find out which is sold more.
In that case, is that possible to apply proc corr between the accounts?
- Mark as New
- Bookmark
- Subscribe
- Mute
- RSS Feed
- Permalink
- Report Inappropriate Content
I'm using proc corr to find out the relationship between account. It means how 'checking' was sold when compared to the other accounts like saving, mortgage and credit_card.
Please let me know if we've any other better solution for this apporoach.

- Mark as New
- Bookmark
- Subscribe
- Mute
- RSS Feed
- Permalink
- Report Inappropriate Content
Dear RamKumar,
find below the answer:
1- for transpose the following example for your data:
data test;
input cust $ account $ balance:comma12.2;
cards;
Smith checking $1,000.00
Smith Savings $4,000.00
Smith mortgage $150,000.00
Smith credit_card $500.00
Jones checking $973.78
Jones savings $2,613
Jones Mortgage .
Jones credit_card $140.48
;
run;
PROC SORT
DATA=WORK.TEST(KEEP=balance account cust)
OUT=WORK.SORTTempTableSorted
;
BY cust;
RUN;
PROC TRANSPOSE DATA=WORK.SORTTempTableSorted
OUT=WORK.TRNSTransposedTEST(LABEL="Transposed WORK.TEST")
LET
NAME=Source
LABEL=Label
;
BY cust;
ID account;
VAR balance;
/* -------------------------------------------------------------------
End of task code.
------------------------------------------------------------------- */
RUN; QUIT;
2- Proc Cor is the best procedure to calculate the correlation as you need.

- Mark as New
- Bookmark
- Subscribe
- Mute
- RSS Feed
- Permalink
- Report Inappropriate Content
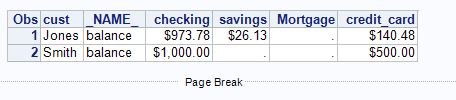
Assuming balance is numeric and formatted with DOLLAR format it will be associated with the new variables when transposed. You also need to "standardize" all the values of ACCOUNT. I used UPCASE.
infile cards expandtabs;
input cust $ account :$upcase16. balance :comma12.;
format balance dollar12.2;
cards;
Smith checking $1,000.00
Smith Savings $4,000.00
Smith mortgage $150,000.00
Smith credit_card $500.00
Jones checking $973.78
Jones savings $2,613
Jones Mortgage .
Jones credit_card $140.48
;;;;
run;
proc print;
run;
proc transpose out=wide;
by cust notsorted;
id account;
var balance;
run;
proc print;
run;
- Mark as New
- Bookmark
- Subscribe
- Mute
- RSS Feed
- Permalink
- Report Inappropriate Content
Thanks everyone, just I wondering for the response on 'proc corr'.
I need to find out each account goes with other account (how many customers brought savings account along with Mortgage account). In proc corr I can correlate only with two variables, but I wish to correlate with 4 variables here.
Is any other alternate procedure or other function/queries available for my approach?

- Mark as New
- Bookmark
- Subscribe
- Mute
- RSS Feed
- Permalink
- Report Inappropriate Content
data have ;
input cust $ account $15. balance ;
format balance dollar9.2;
informat balance dollar9.2;
cards ;
Smith checking $1,000.00
Smith Savings $4,000.00
Smith mortgage $150,000.00
Smith credit_card $500.00
Jones checking $973.78
Jones savings $2,613
Jones Mortgage .
Jones credit_card $140.48
;
run;
proc sort data=have;
by cust;
run;
proc transpose data=have out=want;
by cust ;
id account;
var balance;
run;
proc print data = want;
run;

- Mark as New
- Bookmark
- Subscribe
- Mute
- RSS Feed
- Permalink
- Report Inappropriate Content
If you are looking for correlation of one variable with remaining variables. This may be helpful.
proc corr data=have;
var checking saving mortgage credit_card;
run;
- Mark as New
- Bookmark
- Subscribe
- Mute
- RSS Feed
- Permalink
- Report Inappropriate Content
Thanks for the code. When I ran your code with some additional data, I got the output as below.
Pearson Correlation Coefficients
Prob > |r| under H0: Rho=0
Number of Observations
CREDIT_
CHECKING SAVINGS MORTGAGE CARD
CHECKING 1.00000 1.00000 . 1.00000
. . . .
2 2 1 2
SAVINGS 1.00000 1.00000 . 1.00000
. . .
2 3 1 2
MORTGAGE . . 1.00000 .
. . . .
1 1 2 1
With this output I couldn't figure out whether we have positive or negative correlation. Please suggest me over here.
- Mark as New
- Bookmark
- Subscribe
- Mute
- RSS Feed
- Permalink
- Report Inappropriate Content
Not sure, If you can share some data then it would be more clear.
- Mark as New
- Bookmark
- Subscribe
- Mute
- RSS Feed
- Permalink
- Report Inappropriate Content
- Mark as New
- Bookmark
- Subscribe
- Mute
- RSS Feed
- Permalink
- Report Inappropriate Content
if you will have negative correlation you will see the negative numbers. but it seems your data with positive correlations
- Mark as New
- Bookmark
- Subscribe
- Mute
- RSS Feed
- Permalink
- Report Inappropriate Content
I've created a new thread https://communities.sas.com/message/227831#22783 instead of mess up with the current one which relates to transpose.
.jpg")
Catch up on SAS Innovate 2026
Nearly 200 sessions are now available on demand with the SAS Innovate Digital Pass.
Explore Now →Learn the difference between classical and Bayesian statistical approaches and see a few PROC examples to perform Bayesian analysis in this video.

Find more tutorials on the SAS Users YouTube channel.
SAS Training: Just a Click Away
Ready to level-up your skills? Choose your own adventure.
-
11 replies
-
09-09-2014 04:07 AM
-
4697 views
-
0 likes
-
5 in conversation
-
