- Home
- /
- Programming
- /
- SAS Procedures
- /
- How to make a summary table?
- RSS Feed
- Mark Topic as New
- Mark Topic as Read
- Float this Topic for Current User
- Bookmark
- Subscribe
- Mute
- Printer Friendly Page

- Mark as New
- Bookmark
- Subscribe
- Mute
- RSS Feed
- Permalink
- Report Inappropriate Content
Hi, how can I make a summary table like this one:
mean median min max std
var1 a b c d e
var2 f g h i j
var3 k l n o p
where a,b,c,... is calculated. Now i only have it as one row. also, for the median I have instead of just 1 number a lot of number (all the number of that column).
Thank you very much!
Accepted Solutions

- Mark as New
- Bookmark
- Subscribe
- Mute
- RSS Feed
- Permalink
- Report Inappropriate Content
You have to declare the statistics that you want. e.g.:
proc means data=sashelp.class min max mean median stackods;
var height weight;
weight age;
output out=sample_summary median= mean= min= max= stddev= /autoname;
run;
- Mark as New
- Bookmark
- Subscribe
- Mute
- RSS Feed
- Permalink
- Report Inappropriate Content
It would help to see either your data or a subset of it. However, what you are looking for is probably proc means.
Take a look at: http://support.sas.com/documentation/cdl/en/proc/61895/HTML/default/viewer.htm#a000146729.htm

- Mark as New
- Bookmark
- Subscribe
- Mute
- RSS Feed
- Permalink
- Report Inappropriate Content
If you have version 9.3 then try the following:
proc means data=sashelp.class stackods;
var height weight age;
output out=sample_summary;
run;
- Mark as New
- Bookmark
- Subscribe
- Mute
- RSS Feed
- Permalink
- Report Inappropriate Content
but those means are weighted means. so just want to get the layout or is that also possible to do the weighted means with the proc means
- Mark as New
- Bookmark
- Subscribe
- Mute
- RSS Feed
- Permalink
- Report Inappropriate Content
Why do you say they are weighted means? They would only be weighted means if a weight statement was included for the proc.
- Mark as New
- Bookmark
- Subscribe
- Mute
- RSS Feed
- Permalink
- Report Inappropriate Content
I mean that the means i want to calculate in my table are weighted mean. So if i do 'proc mean' i would get the normal means right. So i wonder if i can have the weighted means by using 'proc means'.
- Mark as New
- Bookmark
- Subscribe
- Mute
- RSS Feed
- Permalink
- Report Inappropriate Content
Yes. You simply have to include a statement like:
proc means data=sashelp.class stackods;
var height weight;
/*->*/ weight age;
output out=sample_summary;
run;
- Mark as New
- Bookmark
- Subscribe
- Mute
- RSS Feed
- Permalink
- Report Inappropriate Content
proc means data=sasdata.have;
var avg_return avg_expense avg_turnover ;
weight weights;
output out= sasdata.summary_statistics;
run;
"stackods" did not work for me, i think because i have version 9.2. but i don't have the median in the table
- Mark as New
- Bookmark
- Subscribe
- Mute
- RSS Feed
- Permalink
- Report Inappropriate Content
You have to declare the statistics that you want. e.g.:
proc means data=sashelp.class min max mean median stackods;
var height weight;
weight age;
output out=sample_summary median= mean= min= max= stddev= /autoname;
run;
- Mark as New
- Bookmark
- Subscribe
- Mute
- RSS Feed
- Permalink
- Report Inappropriate Content
Thank you for your help!!

- Mark as New
- Bookmark
- Subscribe
- Mute
- RSS Feed
- Permalink
- Report Inappropriate Content
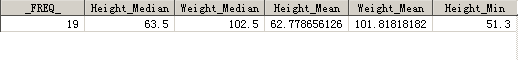
Very interesting thing, Although the output of proc means looks good , but output dataset does not look right.
filename  x temp;
proc printto print=x; run;
proc means data=sashelp.class min max mean median ;
  var height weight;
  weight age;
run;
proc printto;run;
data want;
 infile x firstobs=7;
 input variable : $40. @;
 if variable not eq: '--' then do;input min max mean median; output;end;
run;
Ksharp
- Mark as New
- Bookmark
- Subscribe
- Mute
- RSS Feed
- Permalink
- Report Inappropriate Content
- Mark as New
- Bookmark
- Subscribe
- Mute
- RSS Feed
- Permalink
- Report Inappropriate Content
ArthurT,
My SAS9.2 can't work with option stackods . It looks like ,which might not be what OP want.

- Mark as New
- Bookmark
- Subscribe
- Mute
- RSS Feed
- Permalink
- Report Inappropriate Content
I think with 9.2 "you" will need to fiddle with the output to get what the OP is looking for.
var height weight age;
output out=summary median= mean= min= max= stddev= /autoname;
run;
proc transpose data=summary(drop=_type_ _freq_) out=tall;
run;
data tall;
set tall;
length variable $32;
_ = find(_name_,'_',-32);
variable = substr(_name_,1,_-1);
_name_ = substr(_name_,_+1);
run;
proc sort;
by variable;
run;
proc transpose data=tall out=notsotall;
by variable;
var col1;
run;
- Mark as New
- Bookmark
- Subscribe
- Mute
- RSS Feed
- Permalink
- Report Inappropriate Content
Can I also make summary tables by five year interval (i.e 1980,85,90,95,00..) including the number of unique id in those years? Thank you very much.
.jpg")
Catch up on SAS Innovate 2026
Nearly 200 sessions are now available on demand with the SAS Innovate Digital Pass.
Explore Now →Learn the difference between classical and Bayesian statistical approaches and see a few PROC examples to perform Bayesian analysis in this video.

Find more tutorials on the SAS Users YouTube channel.
SAS Training: Just a Click Away
Ready to level-up your skills? Choose your own adventure.
-
20 replies
-
11-09-2012 03:20 PM
-
8021 views
-
7 likes
-
5 in conversation
-
