- Home
- /
- Programming
- /
- SAS Procedures
- /
- Re: How to change Output tables from proc GLM?
- RSS Feed
- Mark Topic as New
- Mark Topic as Read
- Float this Topic for Current User
- Bookmark
- Subscribe
- Mute
- Printer Friendly Page

- Mark as New
- Bookmark
- Subscribe
- Mute
- RSS Feed
- Permalink
- Report Inappropriate Content
Hi,
I’m working with big data sets very often and normally every data set has several independent variables. Sometimes I need to do ANOVA and get main effects and interaction effects as well as post hoc grouping such as Duncan’s grouping for them. Regarding the output Proc GLM, I’m facing with 2 big problems: after doing analysis and getting e.g. Duncan’s grouping, the tables from GLM procedure are arranged with a combination of variables from biggest values to lowest one, and also the alphabets representing each category is in the same row with the Mean, but not the same cell. These two problems cost me to spend so much time and sometimes get frustrated to rearrange them again and put those alphabets on each mean value as superscript, appropriate for publication. I do some arrangement with Proc sort, but that is not exactly what I really need. So I would like to know:
- 1. Is there any way to change this output format in an another way based on the arrangement of treatments and not base on biggest value to smallest one, or any other desire format (still containing Duncan’s grouping)?
- 2. Is there any way to change the location of those alphabets that represent Duncan’s grouping from being in a separate cell to the same cell with Mean values as superscript, as we publish in journals?
- for example how can I change the following table :
| A | 16.6 | 30 | Rapid |
| A | |||
| A | 16.1 | 28 | Slow |
| B | 10.8 | 30 | CO_slow |
| B | |||
| B | 10.6 | 30 | CO_ rapid |
To this:
10.6B | 30 | CO_rapid |
10.8B | 30 | CO_slow |
16.1A | 28 | slow |
16.6A | 30 | rapid |
I would greatly appreciate any help you may give me, especially if you can write the needed program.
Thank you.
Accepted Solutions

- Mark as New
- Bookmark
- Subscribe
- Mute
- RSS Feed
- Permalink
- Report Inappropriate Content
How about this? It seems similar to what you want.
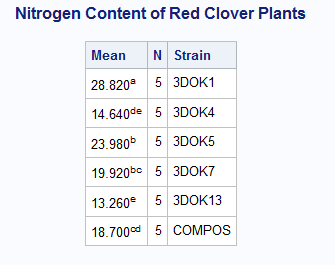
data Clover;
input Strain $ Nitrogen @@;
datalines;
3DOK1 19.4 3DOK1 32.6 3DOK1 27.0 3DOK1 32.1 3DOK1 33.0
3DOK5 17.7 3DOK5 24.8 3DOK5 27.9 3DOK5 25.2 3DOK5 24.3
3DOK4 17.0 3DOK4 19.4 3DOK4 9.1 3DOK4 11.9 3DOK4 15.8
3DOK7 20.7 3DOK7 21.0 3DOK7 20.5 3DOK7 18.8 3DOK7 18.6
3DOK13 14.3 3DOK13 14.4 3DOK13 11.8 3DOK13 11.6 3DOK13 14.2
COMPOS 17.3 COMPOS 19.4 COMPOS 19.1 COMPOS 16.9 COMPOS 20.8
;
run;
ods trace on;
ods select none;
proc glm data=Clover;
class Strain;
model Nitrogen = Strain;
means Strain / duncan;
ods output MCLines=MCLines;
run;
ods select all;
ods trace off;
proc sort data=MCLines out=means sortseq=LINGUISTIC(NUMERIC_COLLATION=on);
by level;
where not missing(mean);
run;
data means;
set means;
array l
supermean = cats(vvalue(mean),catx(
run;
proc print noobs label;
var supermean n level;
label supermean='Mean';
run;
- Mark as New
- Bookmark
- Subscribe
- Mute
- RSS Feed
- Permalink
- Report Inappropriate Content
How about this? It seems similar to what you want.
data Clover;
input Strain $ Nitrogen @@;
datalines;
3DOK1 19.4 3DOK1 32.6 3DOK1 27.0 3DOK1 32.1 3DOK1 33.0
3DOK5 17.7 3DOK5 24.8 3DOK5 27.9 3DOK5 25.2 3DOK5 24.3
3DOK4 17.0 3DOK4 19.4 3DOK4 9.1 3DOK4 11.9 3DOK4 15.8
3DOK7 20.7 3DOK7 21.0 3DOK7 20.5 3DOK7 18.8 3DOK7 18.6
3DOK13 14.3 3DOK13 14.4 3DOK13 11.8 3DOK13 11.6 3DOK13 14.2
COMPOS 17.3 COMPOS 19.4 COMPOS 19.1 COMPOS 16.9 COMPOS 20.8
;
run;
ods trace on;
ods select none;
proc glm data=Clover;
class Strain;
model Nitrogen = Strain;
means Strain / duncan;
ods output MCLines=MCLines;
run;
ods select all;
ods trace off;
proc sort data=MCLines out=means sortseq=LINGUISTIC(NUMERIC_COLLATION=on);
by level;
where not missing(mean);
run;
data means;
set means;
array l
supermean = cats(vvalue(mean),catx(
run;
proc print noobs label;
var supermean n level;
label supermean='Mean';
run;
- Mark as New
- Bookmark
- Subscribe
- Mute
- RSS Feed
- Permalink
- Report Inappropriate Content
I'm very excited, because the table that you have created is almost the one that I want. I tried to run the program, but I got the following errors:
My SAS is 9.2, does it have anything to do with these errors?
ERROR: Cannot perform linguistic collation.
NOTE: The SAS System stopped processing this step because of errors.
WARNING: The data set WORK.MEANS may be incomplete. When this step was stopped there were 0
observations and 0 variables.
WARNING: Data set WORK.MEANS was not replaced because this step was stopped.
NOTE: PROCEDURE SORT used (Total process time):
real time 0.05 seconds
cpu time 0.03 seconds
12780 data means;
12781 set means;
12782 array l
WARNING: Defining an array with zero elements.
12783 call sortc(of l
-----
716
WARNING 716-185: Argument #1 is a numeric variable, while a character variable must be passed to
the SORTC subroutine call in order for the variable to be updated.
12784 super = lowcase(cats(of l
12785 supermean = cats(vvalue(mean),catx(' ','(*ESC*){super',super,'}'));
12786 run;
NOTE: Numeric values have been converted to character values at the places given by:
(Line):(Column).
12783:18
NOTE: The SAS System stopped processing this step because of errors.
WARNING: The data set WORK.MEANS may be incomplete. When this step was stopped there were 0
observations and 3 variables.
WARNING: Data set WORK.MEANS was not replaced because this step was stopped.
NOTE: DATA statement used (Total process time):
real time 0.06 seconds
cpu time 0.03 seconds
ERROR: Could not find extension: (icudt34)
ERROR: Unable to load extension: (lceicu)
12787 proc print noobs label;
12788 var supermean n level;
ERROR: Variable SUPERMEAN not found.
12789 label supermean='Mean';
12790 run;
NOTE: The SAS System stopped processing this step because of errors.
NOTE: PROCEDURE PRINT used (Total process time):
real time 0.00 seconds
cpu time 0.01 seconds
- Mark as New
- Bookmark
- Subscribe
- Mute
- RSS Feed
- Permalink
- Report Inappropriate Content
I just tested my program with SAS 9.2 and it worked as with SAS 9.3.
Your error is actually happening before the log snippet you included.
Lets see your GLM and the rest above.
You may want to start SAS again the 12780 or so lines before may be the problem too.
- Mark as New
- Bookmark
- Subscribe
- Mute
- RSS Feed
- Permalink
- Report Inappropriate Content
Interesting...I searched SAS document and I got this : http://support.sas.com/kb/37/541.html
Apparently, my sas which is 9.2 TS1MO, has problem with using proc sort and using linguistic argument. So, I just deleted "Linguistic" word from your program and it started to work perfectly! But, I still need your expertise: 1. How can I delete the "N" column and also change the location of strain and Mean column so that strain goes to the left side? 2. How can I change those alphabets to capital ones.
Thank you very much for your help.
- Mark as New
- Bookmark
- Subscribe
- Mute
- RSS Feed
- Permalink
- Report Inappropriate Content
Look at the VAR statement in PROC PRINT.
Remove the lowcase function where I create super.
- Mark as New
- Bookmark
- Subscribe
- Mute
- RSS Feed
- Permalink
- Report Inappropriate Content
Thank you saved my time.
.jpg")
Catch up on SAS Innovate 2026
Nearly 200 sessions are now available on demand with the SAS Innovate Digital Pass.
Explore Now →Learn the difference between classical and Bayesian statistical approaches and see a few PROC examples to perform Bayesian analysis in this video.

Find more tutorials on the SAS Users YouTube channel.
SAS Training: Just a Click Away
Ready to level-up your skills? Choose your own adventure.
-
6 replies
-
10-31-2014 01:28 PM
-
4741 views
-
3 likes
-
2 in conversation
-
