- Home
- /
- Programming
- /
- SAS Procedures
- /
- Re: How can I combine 2 columns into one?
- RSS Feed
- Mark Topic as New
- Mark Topic as Read
- Float this Topic for Current User
- Bookmark
- Subscribe
- Mute
- Printer Friendly Page

- Mark as New
- Bookmark
- Subscribe
- Mute
- RSS Feed
- Permalink
- Report Inappropriate Content
I would like to combine columns into one. But i don't know how to do so. My data set is like this:
Period ColA ColB ColC
1 1
1 2
1 3
2 1
2 2
3 5
3 8
And i would like to combine the same column of period into one. like this:
Period ColA ColB ColC
1 1 2 3
2 1 2
3 5 8
i have tried many times but it still doesn't work.

- Mark as New
- Bookmark
- Subscribe
- Mute
- RSS Feed
- Permalink
- Report Inappropriate Content
There is probably a more efficient way of doing what you want, but the following will accomplish the task:
data have;
input Period ColA ColB ColC;
cards;
1 1 . .
1 . 2 .
1 . . 3
2 1 . .
2 . 2 .
3 5 . .
3 . . 8
;
data firstonly;
set have;
by Period;
if first.Period;
run;
data want;
update firstonly have;
by Period;
run;

- Mark as New
- Bookmark
- Subscribe
- Mute
- RSS Feed
- Permalink
- Report Inappropriate Content
You can use the UPDATE statement. This will take the last non-missing value for each variable. It wants a master table and an update table, but you can just use OBS=0 to have it start with an empty master table.
data have ;
input Period ColA ColB ColC @@;
cards;
1 1 . . 1 . 2 . 1 . . 3 2 1 . . 2 . 2 . 3 5 . . 3 . . 8
run;
data want ;
update have(obs=0) have ;
by period;
run;
data _null_;
set want;
put (_All_) (:) ;
run;
1 1 2 3
2 1 2 .
3 5 . 8

- Mark as New
- Bookmark
- Subscribe
- Mute
- RSS Feed
- Permalink
- Report Inappropriate Content
And in SQL:
PROC SQL;
CREATE TABLE WANT AS
SELECT Period,
(MAX(ColA)) AS ColA,
(MAX(ColB)) AS ColB,
(MAX(ColC)) AS ColC
FROM HAVE
GROUP BY Period;
QUIT;
Tom

- Mark as New
- Bookmark
- Subscribe
- Mute
- RSS Feed
- Permalink
- Report Inappropriate Content
proc summary data=have nway ;
class period ;
var col: ;
output out=want(drop = _type_ _freq_) mean= ;
run ;
- Mark as New
- Bookmark
- Subscribe
- Mute
- RSS Feed
- Permalink
- Report Inappropriate Content
: Definitely an interesting way to do it but, from my test, Tom's method runs almost twice as fast. I ran:
/* Create some sample data */
data have (drop=_:);
input _Period ColA ColB ColC;
do Period=_Period to _Period+999;
output;
end;
cards;
1 1 . .
1 . 2 .
1 . . 3
1001 1 . .
1001 . 2 .
2001 5 . .
2001 . . 8
3001 1 . .
3001 . 2 .
3001 . . 3
4001 1 . .
4001 . 2 .
5001 5 . .
5001 . . 8
6001 1 . .
6001 . 2 .
7001 5 . .
7001 . . 8
8001 1 . .
8001 . 2 .
8001 . . 3
9001 1 . .
9001 . 2 .
10001 5 . .
10001 . . 8
;
proc sort data=have;
by period;
run;
/*Howard's suggested code*/
proc summary data=have nway ;
class period ;
var col: ;
output out=want(drop = _type_ _freq_) mean= ;
run ;
/*Tom's suggested code*/
data want ;
update have(obs=0) have ;
by period;
run;

- Mark as New
- Bookmark
- Subscribe
- Mute
- RSS Feed
- Permalink
- Report Inappropriate Content
This should run as quickly as Tom's SQL, I hope (although it is more verbose!):
data lastonly (drop=t_:);
set have (rename=(ColA=t_A ColB=t_B ColC=t_C));
by Period;
length ColA ColB ColC 8.;
retain ColA ColB ColC;
if first.Period then do;
ColA = .;
ColB = .;
ColC = .;
end;
ColA = max(ColA,t_A);
ColB = max(ColB,t_B);
ColC = max(ColC,t_C);
if last.Period then output;
run;
- Mark as New
- Bookmark
- Subscribe
- Mute
- RSS Feed
- Permalink
- Report Inappropriate Content
I love Tom's solution (never seen that pattern before), but I'm also a big fan of PROC SUMMARY/MEANS. I was wondering if procedure startup code explained the time differences, so I ran some tests at higher volumes. Note that the times for "Tom" include a sort, as it is required for his pattern, whereas the SUMMARY doesn't need to be sorted. The times were:
Summary Tables
| Howard | Tom | |||
|---|---|---|---|---|
| volume | Real Time | CPU Time | Real Time | CPU Time |
| 25,000 observations | 0:00.47 | 0:00.21 | 0:00.03 | 0:00.02 |
| 250,000 observations | 0:00.38 | 0:00.51 | 0:00.16 | 0:00.28 |
| 2,500,000 observations | 0:05.54 | 0:07.17 | 0:01.71 | 0:02.84 |
| 25,000,000 observations | 2:46.00 | 2:06.00 | 1:23.00 | 0:41.00 |
Generated by the SAS System ('Local', X64_7PRO) on
November 26, 2012 at 4:26:14 PM
And as a chart:
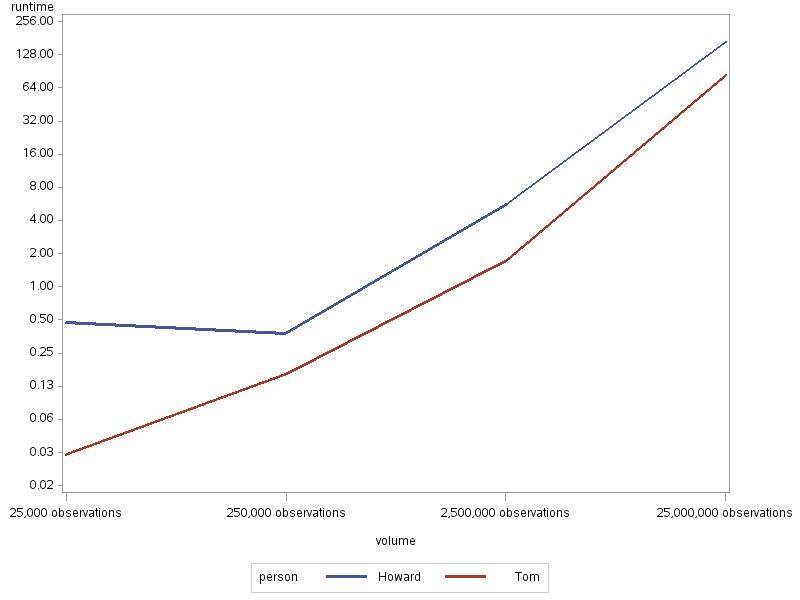
Howver, the 25 million row with SUMMARY run required disk work space, so I reran it with increased memsize. Here's the result:
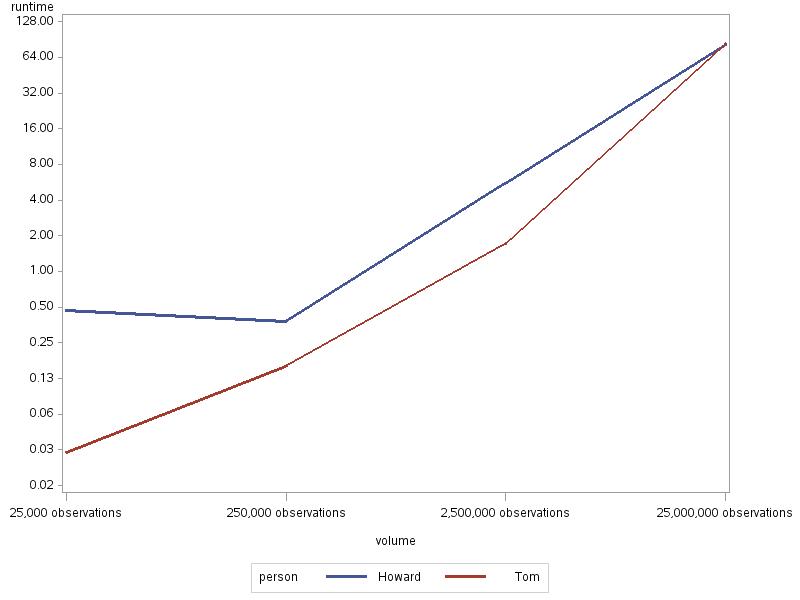
Note the vertical scale is log.
So:
Tom's technique is as efficient as it gets;
PROC SUMMARY will somewhat catch up at higher volumes, but requires more memory;
I just blew a whole afternoon, and enjoyed every bit of it!
Tom
- Mark as New
- Bookmark
- Subscribe
- Mute
- RSS Feed
- Permalink
- Report Inappropriate Content
It depends on what answer you want. Using the UPDATE statement will take the last non-missing value. Calculating a statistic such MEAN, MIN or MAX could get a different answer when there are multiple non-missing values of a variable within the same by group.

- Mark as New
- Bookmark
- Subscribe
- Mute
- RSS Feed
- Permalink
- Report Inappropriate Content
Here is another approach, although not quite sure how efficient that would be:
data _null_;
if(1=2) then set have;
declare hash cols(ordered:"a");
cols.defineKey("period");
cols.defineData("period","colA", "colB", "colC");
cols.defineDone();
do until(done);
set have end=done;
x1=colA; x2=colB; x3=colC;
rc1=cols.find();
y1=max(x1, colA); y2=max(x2, colB); y3=max(x3, colC);
rc2=cols.replace(key:period,data:period,data:y1,data:y2,data:y3);
end;
cols.output(dataset:"want");
stop;
run;
RESULTS:
| Period | ColA | ColB | ColC | |
|---|---|---|---|---|
| 1 | 1 | 1 | 2 | 3 |
| 2 | 2 | 1 | 2 | . |
| 3 | 3 | 5 | . | 8 |
- Mark as New
- Bookmark
- Subscribe
- Mute
- RSS Feed
- Permalink
- Report Inappropriate Content
- Mark as New
- Bookmark
- Subscribe
- Mute
- RSS Feed
- Permalink
- Report Inappropriate Content
Wow! Many thanks, Tom.
Will keep that in mind.
Kind regards,
Joe
- Mark as New
- Bookmark
- Subscribe
- Mute
- RSS Feed
- Permalink
- Report Inappropriate Content
Actually, I suggested another approach...but I don't have time to time it ![]()
- Mark as New
- Bookmark
- Subscribe
- Mute
- RSS Feed
- Permalink
- Report Inappropriate Content
.jpg")
Catch up on SAS Innovate 2026
Nearly 200 sessions are now available on demand with the SAS Innovate Digital Pass.
Explore Now →Learn the difference between classical and Bayesian statistical approaches and see a few PROC examples to perform Bayesian analysis in this video.

Find more tutorials on the SAS Users YouTube channel.
SAS Training: Just a Click Away
Ready to level-up your skills? Choose your own adventure.
-
13 replies
-
11-24-2012 10:35 AM
-
6495 views
-
0 likes
-
7 in conversation
-
