- Home
- /
- Programming
- /
- SAS Procedures
- /
- Controlling Proc Tabulate output
- RSS Feed
- Mark Topic as New
- Mark Topic as Read
- Float this Topic for Current User
- Bookmark
- Subscribe
- Mute
- Printer Friendly Page

- Mark as New
- Bookmark
- Subscribe
- Mute
- RSS Feed
- Permalink
- Report Inappropriate Content
I want to remove 'all' column from output but still want to use the keyword in order to display my table vertically, is there any way i can remove the ALL column from inside Proc tabulate or by using ODS?
here is my code -
proc tabulate data=cat_table missing order=data;
class varname xcat ncp1 ncp2 p_v;
table varname*(xcat *ncp1 *ncp2 *p_v ), all;
label varname='Variable Name'
xcat=""
ncp1='Level1'
ncp2='Level2';
run;

- Mark as New
- Bookmark
- Subscribe
- Mute
- RSS Feed
- Permalink
- Report Inappropriate Content
Since you're only looking for counts trying putting the N where the all is:
proc tabulate data=cat_table missing order=data;
class varname xcat ncp1 ncp2 p_v;
table varname*(xcat *ncp1 *ncp2 *p_v ), N="Awesome Total";
label varname='Variable Name'
xcat=""
ncp1='Level1'
ncp2='Level2';
run;
- Mark as New
- Bookmark
- Subscribe
- Mute
- RSS Feed
- Permalink
- Report Inappropriate Content
Thanks Reeza, but i dont want anything in last column, I am just using these to get a vertical display, in output i would like to suppress these.
- Mark as New
- Bookmark
- Subscribe
- Mute
- RSS Feed
- Permalink
- Report Inappropriate Content
Ok. Why not use proc freq with list option or proc sql with distinct option.
proc sql;
select distinct varname label='label1', xcat, ncp1, ncp2, p_v
from cat_table;
quit;
proc freq data=want noprint;
table varname*xcat *ncp1 *ncp2 *p_v/list out=summary1 (drop=count percent);
run;

- Mark as New
- Bookmark
- Subscribe
- Mute
- RSS Feed
- Permalink
- Report Inappropriate Content
if you want NO STATS, don't use tabulate, just SORT
lovedeep wrote:

I want to remove 'all' column from output but still want to use the keyword in order to display my table vertically, is there any way i can remove the ALL column from inside Proc tabulate or by using ODS?

here is my code -

proc tabulate data=cat_table missing order=data;
class varname xcat ncp1 ncp2 p_v;
table varname*(xcat *ncp1 *ncp2 *p_v ), all;
label varname='Variable Name'
      xcat=""
   ncp1='Level1'
   ncp2='Level2';
run;
PROC SORT data=cat_table( keep= varname xcat ncp1 ncp2 p_v )
nodupkey out= output_dataset( RENAME= (NCP1 = Level1 ncp2=Level2) ) ;
by varname xcat ncp1 ncp2 p_v ;
run ;
proc print ;
run ;
- Mark as New
- Bookmark
- Subscribe
- Mute
- RSS Feed
- Permalink
- Report Inappropriate Content
Peter.C wrote:

if you want NO STATS, don't use tabulate, just SORT

lovedeep wrote:

I want to remove 'all' column from output but still want to use the keyword in order to display my table vertically, is there any way i can remove the ALL column from inside Proc tabulate or by using ODS?

here is my code -

proc tabulate data=cat_table missing order=data;
class varname xcat ncp1 ncp2 p_v;
table varname*(xcat *ncp1 *ncp2 *p_v ), all;
label varname='Variable Name'
      xcat=""
   ncp1='Level1'
   ncp2='Level2';
run;

PROC SORT data=cat_table( keep= varname xcat ncp1 ncp2 p_v )
nodupkey out= output_dataset( RENAME= (NCP1 = Level1 ncp2=Level2) ) ;
by varname xcat ncp1 ncp2 p_v ;
run ;

proc print ;
run ;
I would have, But I am working on a project and i need to use tabulate, otherwise i could have easily done it with any other proc.
Thanks
- Mark as New
- Bookmark
- Subscribe
- Mute
- RSS Feed
- Permalink
- Report Inappropriate Content
Why do you have to use Tabulate? What does it have that other procedures don't?
- Mark as New
- Bookmark
- Subscribe
- Mute
- RSS Feed
- Permalink
- Report Inappropriate Content
Reeza wrote:

Why do you have to use Tabulate? What does it have that other procedures don't?
It is related to a project needed to be done using using proc tabulate, otherwise i could have achieved the same using report or sql.
Thanks

- Mark as New
- Bookmark
- Subscribe
- Mute
- RSS Feed
- Permalink
- Report Inappropriate Content
Hi:
Since you have posted code, but NOT data, it is hard to visualize the output from your TABULATE step. The issues, that I see are two-fold: 1) not understanding that TABULATE needs to have something in the COLUMN dimension (you can have a table with only a COLUMN dimension, but you can't have a table with only a ROW dimension; and 2) all of your variables are CLASS variables, so you can only get N or PCTN or ALL in the COLUMN dimension. Clearly, your complaint is that you don't want the ALL or the N, but it's not clear to me what your CLASS variables represent. For example, I have made some FAKE data using SASHELP.PRDSALE, where I assigned P_V the value of PRODUCT. That way, I can run your same code, using variables that I had to guess about. As you can see in the screen shot, the left hand side of the table (for VARNAME, XCAT, NCP1, NCP2 and P_V) is in the "ROW" dimension (under the box area), and ALL is in the "COLUMN" dimension to the right of the box area.
The structure of your data will make a difference -- are all your variables character variables? have you pre-calculated any summary statistics? are you trying to produce something like the demographic report shown on page 9 of this paper (http://www2.sas.com/proceedings/forum2008/173-2008.pdf), which shows the multiple variable names/values going down the "row area" with different statistic values in the columns? (The demographic report in the paper was created with PROC REPORT.)
Without any data or any idea of why you don't want the ALL column, it is hard to make a constructive suggestion. TABULATE tables can have 1, 2 or 3 dimensions, but you do not get to pick what dimension shows for a 1-dimensional table -- it's always the COLUMN dimension. A 1-dim table only has COLUMNS; a 2-dim table has ROWS and COLUMNS; a 3-dim table has PAGES, ROWS and COLUMNS. So by the rules of TABULATE, you can't get a TABLE that is only ROWS. The first TABULATE step uses some FAKE data to show what your table looks like so it's easier for folks to visualize (see screen shot); the second TABULATE step illustrates 1, 2 and 3 dimensional tables using TABULATE table operators, like comma and parentheses and asterisk.
Given the code and the fake data, I don't understand what you want to produce. If your data are pre-summarized, then why not use PROC PRINT or PROC REPORT? The job of TABULATE is to group and summarize your table and to present it in tabular form. TABULATE isn't always a good choice for pre-summarized data. But, without knowing ANYTHING about your data, it's all just a guess what you want and what the values are in your data.
Cynthia
** make some fake data;
data cat_table;
set sashelp.prdsale;
varname = catx('~','varname',substr(country,1,1));
xcat = catx(' ','xcat',substr(division,1,1));
ncp1 = region;
ncp2 = prodtype;
p_v = product;
run;
ods listing close;
ods html file='c:\temp\tabulate_question.html';
title;
proc tabulate data=cat_table missing order=data;
class varname xcat ncp1 ncp2 p_v;
table varname*(xcat *ncp1 *ncp2 *p_v ), all;
label varname='Variable Name'
xcat="Xcat"
ncp1='Level1'
ncp2='Level2';
run;
proc tabulate data=sashelp.prdsale;
class country region product;
var actual;
table country ; /* 1-dim all columns */
table region, country / box='2-dim';
table product*region,country / box='2-dim nested row';
table product, region, country*actual*( probt median min max) / box='3-dim with numeric var';
run;
ods html close;

- Mark as New
- Bookmark
- Subscribe
- Mute
- RSS Feed
- Permalink
- Report Inappropriate Content
Cynthia@sas wrote:

Hi:
   Since you have posted code, but NOT data, it is hard to visualize the output from your TABULATE step. The issues, that I see are two-fold: 1) not understanding that TABULATE needs to have something in the COLUMN dimension (you can have a table with only a COLUMN dimension, but you can't have a table with only a ROW dimension; and 2) all of your variables are CLASS variables, so you can only get N or PCTN or ALL in the COLUMN dimension. Clearly, your complaint is that you don't want the ALL or the N, but it's not clear to me what your CLASS variables represent. For example, I have made some FAKE data using SASHELP.PRDSALE, where I assigned P_V the value of PRODUCT. That way, I can run your same code, using variables that I had to guess about. As you can see in the screen shot, the left hand side of the table (for VARNAME, XCAT, NCP1, NCP2 and P_V) is in the "ROW" dimension (under the box area), and ALL is in the "COLUMN" dimension to the right of the box area.

  The structure of your data will make a difference -- are all your variables character variables? have you pre-calculated any summary statistics? are you trying to produce something like the demographic report shown on page 9 of this paper (http://www2.sas.com/proceedings/forum2008/173-2008.pdf), which shows  the multiple variable names/values going down the "row area" with different statistic values in the columns? (The demographic report in the paper was created with PROC REPORT.)

  Without any data or any idea of why you don't want the ALL column, it is hard to make a constructive suggestion. TABULATE tables can have 1, 2 or 3 dimensions, but you do not get to pick what dimension shows for a 1-dimensional table -- it's always the COLUMN dimension. A 1-dim table only has COLUMNS; a 2-dim table has ROWS and COLUMNS; a 3-dim table has PAGES, ROWS and COLUMNS. So by the rules of TABULATE, you can't get a TABLE that is only ROWS. The first TABULATE step uses some FAKE data to show what your table looks like so it's easier for folks to visualize (see screen shot); the second TABULATE step illustrates 1, 2 and 3 dimensional tables using TABULATE table operators, like comma and parentheses and asterisk.

  Given the code and the fake data, I don't understand what you want to produce. If your data are pre-summarized, then why not use PROC PRINT or PROC REPORT? The job of TABULATE is to group and summarize your table and to present it in tabular form. TABULATE isn't always a good choice for pre-summarized data. But, without knowing ANYTHING about your data, it's all just a guess what you want and what the values are in your data.

Cynthia

** make some fake data;
data cat_table;
  set sashelp.prdsale;
  varname = catx('~','varname',substr(country,1,1));
  xcat = catx(' ','xcat',substr(division,1,1));
  ncp1 = region;
  ncp2 = prodtype;
  p_v = product;
run;

ods listing close;
ods html file='c:\temp\tabulate_question.html';
title;
proc tabulate data=cat_table missing order=data;
class varname xcat ncp1 ncp2 p_v;
table varname*(xcat *ncp1 *ncp2 *p_v ), all;
label varname='Variable Name'
      xcat="Xcat"
      ncp1='Level1'
      ncp2='Level2';
run;

proc tabulate data=sashelp.prdsale;
  class country region product;
  var actual;
  table country ; /* 1-dim all columns */
  table region, country / box='2-dim';
  table product*region,country / box='2-dim nested row';
  table product, region, country*actual*( probt median min max) / box='3-dim with numeric var';
run;

ods html close;
Thanks Cynthia for this detailed answer, I am exactly trying to accomplish the same thing as in the paper. I have my summary statistics and p values pre calculated in a dataset and I want to use proc tabulate instead of report to display them.
xcat- variable names
ncp1- ncp2 - Variable counts concatenated with %
p_v - pvalues
I want something very similar to figure-8 from that paper but using tabulate.
Thanks once again
- Mark as New
- Bookmark
- Subscribe
- Mute
- RSS Feed
- Permalink
- Report Inappropriate Content
Hi:
Good luck with that. It will be *very* hard, as long as P_V is a CLASS variable with TABULATE. In my paper, Example 1 was done with PROC REPORT, Example 8 was done with DATA _NULL_ and a custom TABLE template. Example 1 is easier than Example 8 because all you need to do for #1 is manipulate the data in a data step program and then use PROC REPORT. With #8, you need to learn PROC TEMPLATE to generate a custom TABLE template. Since you need to pre-summarize the data to get the p-value, TABULATE will have a hard time doing what you want. As I explained, you must have a COLUMN dimension with PROC TABULATE, so there's no way to do what you originally asked (get rid of the ALL column).
Most of my students use either PROC REPORT or DATA step to generate that type of demographic report. TABULATE is just not well suited. You might be able to pull it off if your P_V variable was numeric and used in a VAR statement, instead of a CLASS statement because that way, you could at least put PV into the COLUMN dimension...but really, without seeing the structure of the data, it's very hard to comment.
cynthia
- Mark as New
- Bookmark
- Subscribe
- Mute
- RSS Feed
- Permalink
- Report Inappropriate Content
Cynthia@sas wrote:

Hi:
  Good luck with that. It will be *very* hard, as long as P_V is a CLASS variable with TABULATE. In my paper, Example 1 was done with PROC REPORT, Example 8 was done with DATA _NULL_ and a custom TABLE template. Example 1 is easier than Example 8 because all you need to do for #1 is manipulate the data in a data step program and then use PROC REPORT. With #8, you need to learn PROC TEMPLATE to generate a custom TABLE template. Since you need to pre-summarize the data to get the p-value, TABULATE will have a hard time doing what you want. As I explained, you must have a COLUMN dimension with PROC TABULATE, so there's no way to do what you originally asked (get rid of the ALL column).

  Most of my students use either PROC REPORT or DATA step to generate that type of demographic report. TABULATE is just not well suited. You might be able to pull it off if your P_V variable was numeric and used in a VAR statement, instead of a CLASS statement because that way, you could at least put PV into the COLUMN dimension...but really, without seeing the structure of the data, it's very hard to comment.

cynthia
Thanks Cynthia,
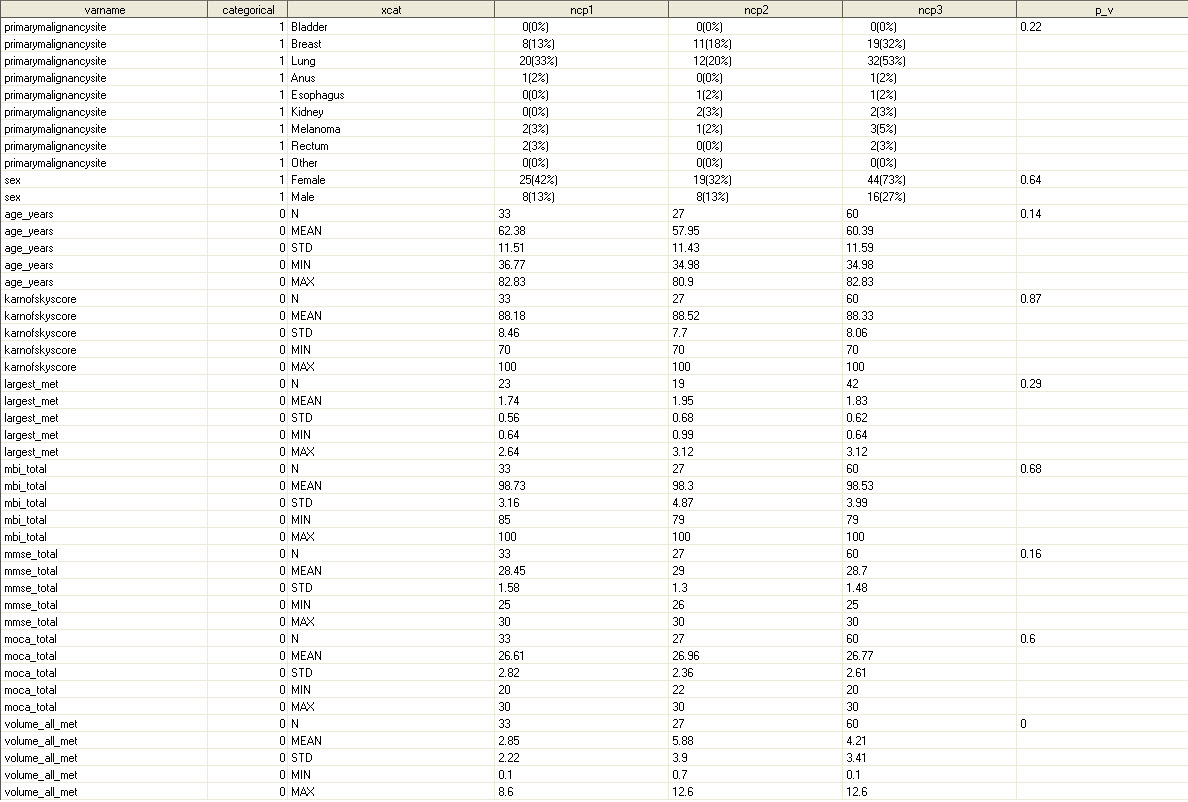
I know its going to be a hard one, Here is the screenshot of my dataset. Can you point me to a good resource to create ta template for my desired output.
- Mark as New
- Bookmark
- Subscribe
- Mute
- RSS Feed
- Permalink
- Report Inappropriate Content
I still don't understand why you NEED to use proc tabulate.
I constantly generate tables like these for Journal publications, but use Report and Print and they work great.
.jpg")
Catch up on SAS Innovate 2026
Nearly 200 sessions are now available on demand in the Innovate Hub.
Watch Now →Learn the difference between classical and Bayesian statistical approaches and see a few PROC examples to perform Bayesian analysis in this video.

Find more tutorials on the SAS Users YouTube channel.
SAS Training: Just a Click Away
Ready to level-up your skills? Choose your own adventure.
-
12 replies
-
01-22-2014 06:26 PM
-
7219 views
-
3 likes
-
4 in conversation
-
