- Home
- /
- Programming
- /
- SAS Procedures
- /
- A simple distribution problem
- RSS Feed
- Mark Topic as New
- Mark Topic as Read
- Float this Topic for Current User
- Bookmark
- Subscribe
- Mute
- Printer Friendly Page

- Mark as New
- Bookmark
- Subscribe
- Mute
- RSS Feed
- Permalink
- Report Inappropriate Content
My id variable is used to identify every observation. And I use very obs as center point of a circle which's radius is 1 mile . Within this circle , I statistical the appearance of obs . And I also check my answer is the same with your State 36 .
Note : the top freq 11 is id 22311....
Ksharp
- Mark as New
- Bookmark
- Subscribe
- Mute
- RSS Feed
- Permalink
- Report Inappropriate Content
Message was edited by: xia keshan

- Mark as New
- Bookmark
- Subscribe
- Mute
- RSS Feed
- Permalink
- Report Inappropriate Content
Snapshot


- Mark as New
- Bookmark
- Subscribe
- Mute
- RSS Feed
- Permalink
- Report Inappropriate Content
Ksharp,
Great work,
Your method is match with my approach. That is great!
However, you answer is not correct.
As PG output shown, he/she can got 14 in State 12.
In my reply, his/her number 14 in State 12 need to plus 6 more and minus 3.
So, the correct number is 17 for State 12 based on PG’s result.
I already said the 17 in State 12 is not the right answer in my last message.
The maximum is greater than 17 if the area is 4 sq miles (2 miles x 2 miles).
In other words, the distance between any two cases in the area cannot larger than 2 miles.
I believe I already provided with enough information for the correct answer.
Thanks and Good Luck,
Dow

- Mark as New
- Bookmark
- Subscribe
- Mute
- RSS Feed
- Permalink
- Report Inappropriate Content
OK, last trial. Change of tool, but still seeking something more efficient than brute force (computing over 5e8 geodetic distances).
Seeking maximum case number inside a 0.5 mile radius circle, centered on a case :
/* Transform Long and Lat into cartesian coordinates centered
roughly on the median location. Use yr_state_case as a unique case No. */
%let latRef=36;
%let lonRef=-87;
proc sql;
create table cases as
select yr, state, 'case'n, latitude, longitud,
catx("_",yr,state,'case'n) as caseNo length=12,
geodist(latitude,longitud,&latref,longitud,"M")*sign(latitude-(&latref)) as Y_Mi,
geodist(latitude,longitud,latitude,&lonref,"M")*sign(longitud-(&lonref)) as X_Mi
from Table;
quit;
/* Guess a maximum value for the number of cases in a cluster, increase if needed */
ods _all_ close;
proc modeclus data=cases dk=50 neighbor;
var X_Mi Y_Mi;
id caseNo;
ods output Neighbor=nCases(where=(distance<=0.5));
run;
ods listing;
/* Fix missing values in ODS table */
data ncases(drop=controlVar rID);
retain rID;
set ncases;
if missing(ID) then ID = rID;
else rID = ID;
run;
proc sql;
create table clusters as
select ID, count(*) as n from nCases group by ID;
/* Extract all big clusters */
create table bigClusterCases as
select ID, nbor, distance, count(*) as n, max(distance) as maxDist
from nCases
group by ID
having count(*) >= (select max(n)-9 from clusters)
order by n descending, maxDist, ID;
/* Find significantly overlapping clusters, inside each pair, indicate the
biggest and the best centered */
create table centerPairs as
select a.ID, a.nbor
from bigClusterCases as a inner join bigClusterCases as b
on a.nbor=b.ID and b.nbor=a.ID and (a.n>b.n or (a.n=b.n and a.maxDist<b.maxDist));
/* Drop the smaller or not as well centered overlapping clusters */
delete from bigClusterCases
where ID in (select nbor from centerPairs);
select unique
n label="Nb Cases in Cluster",
ID label="Cluster Center (Yr_State_Case)",
maxDist label="Maximum Inter-case Distance (mi)"
from bigClusterCases
order by n descending;
quit;
--------
Cluster Maximum
Nb Cases Center Inter-case
in (Yr_State_ Distance
Cluster Case) (mi)
28 2008_36_305 0.468079
27 2005_36_139 0.4915
22 2004_36_1151 0.499706
PG
- Mark as New
- Bookmark
- Subscribe
- Mute
- RSS Feed
- Permalink
- Report Inappropriate Content
PG,
You are the master of SAS.
You only gave me the first piece of information, the top 3 is 28, 27, and 22.
May I have the second piece of information, Yr_State_Case, for the top 3?
I mean those Yr_State_Case they are in the highest density area.
I would like to verify your output,
Thanks,
Dow
- Mark as New
- Bookmark
- Subscribe
- Mute
- RSS Feed
- Permalink
- Report Inappropriate Content
For cluster details, check dataset bigClusterCases after running the SAS code. For a more visual representation using Google Earth, I recycled my code developed in discussion to create the attached kml file (it opens in Google Earth). I was amazed at the precision of the street intersections positioning.
PG
- Mark as New
- Bookmark
- Subscribe
- Mute
- RSS Feed
- Permalink
- Report Inappropriate Content
PG,
I respect your efforts, but I have questions.
Why this output not in your top 3? You can verify it.
Case | Yr | State | LATITUDE | LONGITUD | Miles to Case 54 in Yr 2004 |
1175 | 2005 | 36 |
| -73.99272222 |
|
684 | 2004 | 36 |
| -73.99251389 |
|
222 | 2007 | 36 |
| -73.99253056 |
|
839 | 2004 | 36 |
| -73.99681111 |
|
267 | 2005 | 36 |
| -73.997125 |
|
1132 | 2005 | 36 |
| -73.99564167 |
|
651 | 2008 | 36 |
| -73.99282222 |
|
103 | 2003 | 36 |
| -73.99448056 |
|
941 | 2005 | 36 |
| -73.99698333 |
|
377 | 2008 | 36 |
| -73.99545278 |
|
1138 | 2007 | 36 |
| -73.99847222 |
|
1136 | 2006 | 36 |
| -73.99511667 |
|
1058 | 2008 | 36 |
| -73.99509722 |
|
500 | 2002 | 36 |
| -73.99387778 |
|
418 | 2001 | 36 |
| -73.99863611 |
|
971 | 2008 | 36 |
| -73.998575 |
|
1311 | 2006 | 36 |
| -73.98715833 |
|
1273 | 2003 | 36 |
| -73.99334722 |
|
1137 | 2007 | 36 |
| -73.99436667 |
|
580 | 2004 | 36 |
| -73.99440278 |
|
1167 | 2003 | 36 |
| -73.98670556 |
|
305 | 2008 | 36 |
| -73.99008333 |
|
852 | 2006 | 36 |
| -73.99125556 |
|
296 | 2007 | 36 |
| -73.98825278 |
|
990 | 2004 | 36 |
| -73.984575 |
|
891 | 2003 | 36 |
| -74.00347778 |
|
Case | Yr | State | LATITUDE | LONGITUD |
54 | 2004 | 36 |
| -73.99396111 |
Actually, there are two top 1 when you rounded 0.54 miles to 0.5 miles.
That is why I would like to verify your top 3.
Thanks,
Dow
- Mark as New
- Bookmark
- Subscribe
- Mute
- RSS Feed
- Permalink
- Report Inappropriate Content
Your cluster centered on 2004_36_54 actually overlaps with my first cluster centered on 2008_36_305. According to your table, the two centers are only 0.414879244 mile apart. There are many such overlaping clusters. I kept only clusters with centers separated by more than 0.5 mi. Between overlaping clusters, I choose to keep the clusters with the most cases and between equal numbers of cases, I kept the best centered clusters, i.e. the most compact ones. Your cluster was not retained by my method because it is overlaping with clusters containing more cases.
Did you use SAS tools to find your answer?
PG
- Mark as New
- Bookmark
- Subscribe
- Mute
- RSS Feed
- Permalink
- Report Inappropriate Content
PG, I believe use SAS tool can get answer, and that is why I put the question in here. The goal is to find the highest density and the only limit is one sq mile area. I didn’t put any other limits. That goal cannot be reached if the overlaps become an extra limit in methods. The top 1 in your output is not equal to the two top 1 in my output. Besides, the top 3 in your output has 22 cases. (Actually, 23 cases if 2044_36_1152 included) In my output, the case number is not 22 when 2044_36_1152 is the center. That is why I would like to get the second piece of information. Never mind if you don't have. Thanks for your answers, Dow
- Mark as New
- Bookmark
- Subscribe
- Mute
- RSS Feed
- Permalink
- Report Inappropriate Content
Dow,
This forum is for SAS users helping each other make better use of the software. Beyond the interesting challenge raised by your question, your apparent inability to run my code on your data makes me wonder, with all due respect, what you are seeking here.
PG
- Mark as New
- Bookmark
- Subscribe
- Mute
- RSS Feed
- Permalink
- Report Inappropriate Content
PG, I have 3 certifications from the SAS institute in last 4 years. I did not run your codes not due to inability, but cost. I will run your code when I get a chance to run your codes for free. The cost to run SAS tool is so expensive. The cost-benefit programming is always there to solve the same problem. I would like to compare and find out. I think I already answer your question. Dow
- Mark as New
- Bookmark
- Subscribe
- Mute
- RSS Feed
- Permalink
- Report Inappropriate Content
How about run my code?
I remove the where clause, since you want all year's frequency.
I am not going to run this code ,because you have nearly forty thousand obs which will cost my lots of hours.
proc import datafile='c:\Table 071612.xls' out=have dbms=excel replace;getnames=yes;run;

data have;set have; id+1;run;

proc sql;
create table distance(where=( distance le 1)) as
select a.id,
     geodist(a.latitude,a.longitud,b.latitude,b.longitud ,"M") as distance
from have as a,have as b
  ;
quit;

proc sql;
create table want as
 select id,count(*) as freq
  from distance
   group by id
    order by freq desc;
quit;
Ksharp
- Mark as New
- Bookmark
- Subscribe
- Mute
- RSS Feed
- Permalink
- Report Inappropriate Content
Ksharp,
Your code looks good.
I will run your code when I get a chance to run your codes for free.
Thanks for your inputs,
Dow

- Mark as New
- Bookmark
- Subscribe
- Mute
- RSS Feed
- Permalink
- Report Inappropriate Content
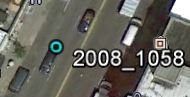
You weren't kidding the mapping is accurate. This poor dot is getting hit by a car!
Anyhow, very interesting topic. I was wondering if anyone knows the capabilities of the open source gis products to do such an analysis? I know it would be fairly straight forward with an arcinfo license, but very costly too.
.jpg")
Catch up on SAS Innovate 2026
Nearly 200 sessions are now available on demand in the Innovate Hub.
Watch Now →Learn the difference between classical and Bayesian statistical approaches and see a few PROC examples to perform Bayesian analysis in this video.

Find more tutorials on the SAS Users YouTube channel.
SAS Training: Just a Click Away
Ready to level-up your skills? Choose your own adventure.
-
31 replies
-
07-15-2012 09:01 AM
-
5923 views
-
0 likes
-
6 in conversation
-
