Turn on suggestions
Auto-suggest helps you quickly narrow down your search results by suggesting possible matches as you type.
Showing results for
- Home
- /
- SAS Japan
- /
- SAS Japan Discussion
- /
- university editionでのグラフ作成について
Options
- RSS Feed
- Mark Topic as New
- Mark Topic as Read
- Float this Topic for Current User
- Bookmark
- Subscribe
- Mute
- Printer Friendly Page
- Mark as New
- Bookmark
- Subscribe
- Mute
- RSS Feed
- Permalink
- Report Inappropriate Content
Posted 06-23-2019 08:20 PM
(1707 views)
お世話になります。
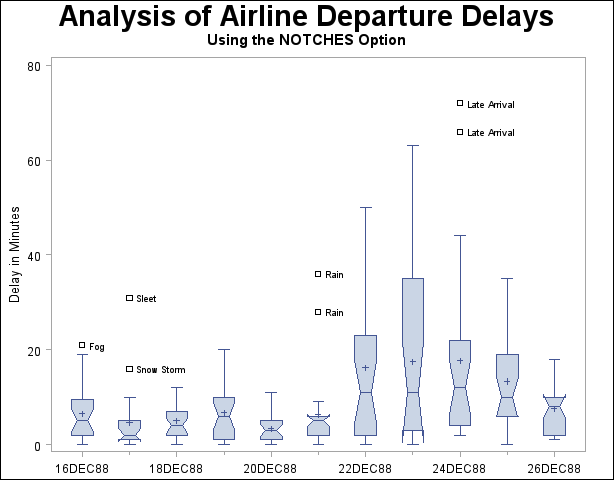
university editionで信頼区間入りの箱ひげ図を作成したいのですが、なるべくGUIでの作業で行えますか?
作成したいのはこのようなグラフです。

宜しくお願い致します。
6 REPLIES 6
- Mark as New
- Bookmark
- Subscribe
- Mute
- RSS Feed
- Permalink
- Report Inappropriate Content
/* Example data */
data stocks;
   set sashelp.stocks;
   where stock = "IBM";
   month = month(date);
run;
1.
2.
3.
4.
- Mark as New
- Bookmark
- Subscribe
- Mute
- RSS Feed
- Permalink
- Report Inappropriate Content
解説お願いします!
- Mark as New
- Bookmark
- Subscribe
- Mute
- RSS Feed
- Permalink
- Report Inappropriate Content
タスク → グラフ →箱ひげ図で一般的には作成できますが、データラベルをGUIで指定することはできないので
タスクで生成されたプログラムをコピーし、DATALABEL=オプションを追加し実行する必要があります。
- Mark as New
- Bookmark
- Subscribe
- Mute
- RSS Feed
- Permalink
- Report Inappropriate Content
箱ひげ図に更に標準偏差を足したりは出来ませんか?
- Mark as New
- Bookmark
- Subscribe
- Mute
- RSS Feed
- Permalink
- Report Inappropriate Content
mean±stdに対応する線を入れたいということであれば、直接対応する機能はないためグラフを重ねるか
SG Anotation機能を使うことになると思います。詳細はドキュメントを読んでみてください。重ねる場合の例は
以下に記載します。
proc means data=stocks noprint;
class month;
var volume;
output out=out mean=mean std=std;
run;

data stocks2;
merge stocks out;
lower=mean-std;
upper=mean+std;
by month;
run;

proc sgplot data=stocks2;
	vbox Volume / category=month notches datalabel=date;
	highlow x=month  low=lower high=upper /
	     lowcap=serif highcap=serif lineattrs=(color=red);
	yaxis grid;
run;- Mark as New
- Bookmark
- Subscribe
- Mute
- RSS Feed
- Permalink
- Report Inappropriate Content
グラフを重ねるという発想はなかったです
SAS Innovate 2025: Register Now
Registration is now open for SAS Innovate 2025 , our biggest and most exciting global event of the year! Join us in Orlando, FL, May 6-9.
Sign up by Dec. 31 to get the 2024 rate of just $495.
Register now!
Upcoming Events
- Ask the Expert: Leveraging R for Statistical Analysis in LSAF | 19-Nov-2024
- Ask the Expert: Wie kann ich SAS® Enterprise Guide® mit SAS® Viya 4 nutzen? | 21-Nov-2024
- Fall OASUS Meeting | 21-Nov-2024
- Fall: Toronto Area SAS User Group (TASUG) Meeting | 03-Dec-2024
- MSUG Free Webinar by Rick Wicklin | 03-Dec-2024
- SAS Innovate 2025 | 06-May-2025


