- RSS Feed
- Mark Topic as New
- Mark Topic as Read
- Float this Topic for Current User
- Bookmark
- Subscribe
- Mute
- Printer Friendly Page

- Mark as New
- Bookmark
- Subscribe
- Mute
- RSS Feed
- Permalink
- Report Inappropriate Content
Hi all,
I had posted earlier about maximizing a product of integrals.
I ran the code and though it runs, the log says that Optimization could not proceed, giving a message along the lines of:
Convergence not obtained on (0 1) due to one of the below reasons:
1. Convergence is slow
2. The integrand has a small scale and the independent variable needs to be changed
3. Oscillating integral values
4. Points of Discontinuities in the integrand
I am trying to maximize a product of integrals over (0,1), where the integrand is a binomial density, with the probability "p" of the binomial depending in
a complicated way on the NormCDF. Actually I am maximizing the sum of the log likelihood in the code below.
I looked at the output and noticed that after about the first 40 iterations, only missing values were bang returned by the calls to QUAD to compute the integrals.
The probabilities being computed in the Binomial are very small(by nature of the data, the probability -i.e the integrand, is small). I need to produce an MLE estimate for the parameter rho in the end.
Would using proc NLP be another approach to solving the problem of getting an MLE for rho? I have only seen optimization done in IML before but would like to know if there are other methods.
I would appreciate any insight about the results above.Thanks for any advice or help.
Here is the code(also in the post Product of integrals and maximization):
N = ... ; /*** N is a constant array of 130 values of n_t. ***/
D = ...; /*** D is a constant array of 130 values of d_t. ***/
ni=0;
di=0;
result=0;
gamma = 0.3 ; /*** gamma is a constant. ***/
val = j(130,1,1); /***column vector initialized to 1's to hold reslt of the integrations using QUAD ***/
iter = 0; /*** Iteration counter initialized to 0 ***/
start Func(y) GLOBAL(gamma,rho,ni, di,N,D);
/***Note: if iter = i then ni = N; di=D***/
u = quantile("Normal", y);
v = sqrt(rho)* u;
p = CDF( "Normal",(gamma - v ) / sqrt(1-rho) ); / *** 0 <= p <= 1, since it is a probability from a CDF ***/
f = pdf("Binomial", di, p, ni); /*** p is the probability parameter for a binomial density with ni trials ***/
return( f );
finish;
/* Step 2. */
/* Define a function that computes the product of the integrals.*/
start Prod_Of_Integral(parms) GLOBAL(rho, val,iter,ni,di,N,D);
/*the optimization parameter is: rho */
rho = parms[1];
yinterval = 0 || 1; /* evaluate integral on [0, 1] */
do i = 1 to 130;
/*** reset iter ***/
/*** reset ni and di ***/
iter = i; ni = N; di = D;
call quad(result, "Func", yinterval); /* evaluate integral on [0, 1] */
/*** update result***/
val =log(result);
end;
return(sum(val));
finish;
* Step 3. */
/*Maximize the product of the integrals to obtain MLE for rho using nlpnra */
/* Set up linear constraint 0 < rho < 1 */
con = {0.0001 ,0.9999}
/* initial guess for solution for rho */
rho_0 = {0.5};
/* find maximum of function */
opt = {1,2} ;
call nlpnra(rc, result, "Prod_Of_Integral", rho_0, opt) blc=con ;

- Mark as New
- Bookmark
- Subscribe
- Mute
- RSS Feed
- Permalink
- Report Inappropriate Content
I assume that d < N for all i, right?
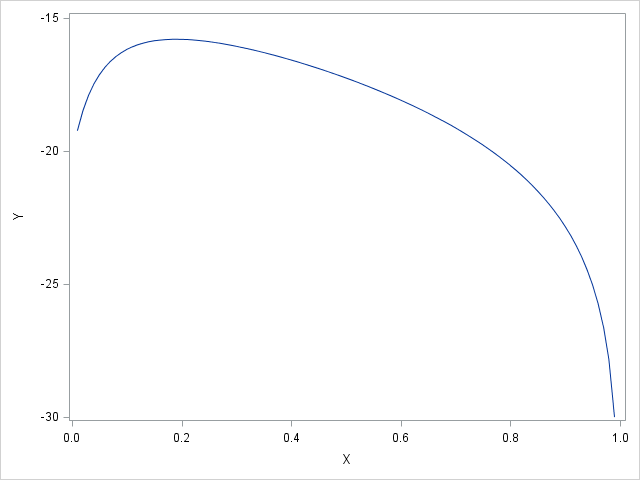
Why don't you visualize the result. It's a 1-D problem, so just evaluate the objective function (Prod_Of_Integral) for a sequence of evenly spaced values of rho, like this:
parms = do(0.01, 0.99, 0.01); /* values of rho */
prod = parms; /* values of product */
do i = 1 to ncol(parms);
prod = Prod_Of_Integral(parms);
end;
call Series(parms, prod); /* SAS/IML 12.3 */
I don't have your values of N and D, but I made up some reasonable values and got a nice curve with a maximum, which is attached.
- Mark as New
- Bookmark
- Subscribe
- Mute
- RSS Feed
- Permalink
- Report Inappropriate Content
Thanks for the suggestion. I will look up the Series function and try plotting.(I'm assuming Series helps create plots).
In the IML output that I obtained earlier from my code(which works okay on smaller data of length 3), it seemed that after about i=44, QUAD was returning empty arrays- so the integrals were not being evaluated. Is this because of some numerical underflow?
But I do think that that the integrand is continuous, and don't think it oscillates. D's are much smaller than N's. A lot of the time I think D's are zero. I'll check again..
Thanks again for the advice.
- Mark as New
- Bookmark
- Subscribe
- Mute
- RSS Feed
- Permalink
- Report Inappropriate Content
When D is large and N is small, I suspect that the objective function does not reach a maximum on the interior of (0,1), but the maximum is at rho=1. Your objective function is undefined for rho=1, which is probably the source of your convergence problem.
- Mark as New
- Bookmark
- Subscribe
- Mute
- RSS Feed
- Permalink
- Report Inappropriate Content
hmm... another update- I was just running the code to plot the function, but it doesn't run: specifically, it says that :
ERROR: (execution) Invalid argument to function.
operation : QUANTILE at line 1001 column 21
I think it means the quantile doesn;t compute...is there anyr eason why this could be happening?
Thanks again!
- Mark as New
- Bookmark
- Subscribe
- Mute
- RSS Feed
- Permalink
- Report Inappropriate Content
The quantile function is defined on the OPEN interval (0,1). Your error is probably from trying to evaluate
an expression like
quantile("Normal",0); /* undefined b/c "negative infinity" */
or
quantile("Normal",1); /* undefined b/c "positive infinity" */
- Mark as New
- Bookmark
- Subscribe
- Mute
- RSS Feed
- Permalink
- Report Inappropriate Content
Thanks for your suggestion above. I modified the input to the quantile function by restricting it away from the endpoints 0 and 1. (Also now the integral of the binomial density itself only goes from 0.01 to 0.99 unlike (0,1) before.)
I am wondering now if I can reformulate the entire model as a Random effects model. Specifically, since the likelihood function is being integrated over all possible values of "y", I am wondering if "y" can be considered as a random effect. In the existing model,
the reason for integration in the likelihood function is that the binomial probability is a CONDITIONAL probability, conditional on values taken by y. (Also y really is unbounded- -infty to +infty, but through a change of variable using y = Normcdf(x), I restricted the integral to being over (0,1). Otherwise, the variable of integration would be x = normcdf, and dx = d(normcdf), which is difficult to write an integration formula for. ).
Anyway I tried using Proc NLmixed, with the code below, but got this error:
NOTE: A finite difference approximation is used for the derivative of the 'PDF' function.
ERROR: Quadrature accuracy of 0.000100 could not be achieved with 31 points. The achieved
accuracy was 0.503703.
Here is the nlmixed code.
proc nlmixed data=bin1 gconv=1e-10 maxiter=200000;
parms rho=0.5; bounds rho >= 0.01, rho <= 0.99;
/** gamma= 0.3 =const **/
/** Id is the observation number **/
w= (gamma - sqrt(rho)*w) / (1-sqrt(rho) );
p = cdf("Normal",w);
/** Likelihood function **/
L= pdf("Binomial",D,p, N);
model d ~ general(L);
random y ~ Normal(0,1) subject=id;;
run;
Thanks so much for your all your guidance and help so far!
- Mark as New
- Bookmark
- Subscribe
- Mute
- RSS Feed
- Permalink
- Report Inappropriate Content
Another update on plotting the likelihood funciton:
When I tried plotting for value of rho given by parms=do(0.01,0.99,0.10), I got these results for prod(which is really a sum log-likelihoods):
prod
COL1 COL2 COL3 COL4 COL5 COL6 COL7 COL8 COL9 COL10
ROW1 -23512.66 -14097.6 -9725.996 -6646.378 -4298.161 -2525.934 -1314.742 -716.5376 -623.4793 -629.5294
But when i tried a finer grid for rho using parms=do(0.01,0.99,0.05), I got the following error message about the lack of convergence again.
Convergence could not be attained over the subinterval
(0.01 , 0.99 )
The function might have one of the following:
1) A slowly convergent or a divergent integral.
2) Strong oscillations.
3) A small scale in the integrand: in this case
you can change the independent variable
in the integrand, or,
provide the optional vector describing roughly
the mean and the standard deviation of the
integrand
4) Points of discontinuities in the interior
in this case, you can provide a vector containing
the points of discontinuity and try again.
The only thing I can conclude is that as rho increases towards 0.99, the likelihood increases (the log-likelihood become less negative). But when the optimizing algorithm tries to call QUAD over certain "problematic" points, there is no convegence. So it may be tha tthe function is actually discontinuous somewhere or the problem is (3) in the LOG message. If it was (3), I would have to do another change of variable: I already changed the independent variable of integration from NormCDF(y) to y. So I would have to search for another change of variable on top of that.
- Mark as New
- Bookmark
- Subscribe
- Mute
- RSS Feed
- Permalink
- Report Inappropriate Content
Here's a blog post that might be useful for these kinds of problems: Define an objective function that evaluates an integral in SAS - The DO Loop
.jpg")
Catch up on SAS Innovate 2026
Nearly 200 sessions are now available on demand in the Innovate Hub.
Watch Now →- Ask the Expert: R and SAS Working Seamlessly Together: Unlocking PROC R in Viya for Life Sciences | 11-Jun-2026
- Ask the Expert: Can Agents Reduce Planning Friction in CPG Supply Chains? | 16-Jun-2026
- Ask the Expert: Get Meaningful Results With New Features in SAS Customer Intelligence 360 | 25-Jun-2026
-
8 replies
-
07-17-2014 03:23 PM
-
4453 views
-
3 likes
-
2 in conversation
-
