- Home
- /
- Learn SAS
- /
- 2021 Presentations
- /
- Haste Makes Waste: Don't Ruin Your Reputation With Hasty Regression
- RSS Feed
- Mark as New
- Mark as Read
- Bookmark
- Subscribe
- Printer Friendly Page
- Report Inappropriate Content
Haste Makes Waste: Don't Ruin Your Reputation With Hasty Regression
- Article History
- RSS Feed
- Mark as New
- Mark as Read
- Bookmark
- Subscribe
- Printer Friendly Page
- Report Inappropriate Content
Steven C. Myers, Ph.D. The University of Akron and econdatascience.com
How do you know if your data is lying to you? The answer lies in following ethical, applied econometric rules and being aware of and avoiding pitfalls in regression practice. These essential skills are not typically taught in single-semester econometric (or regression) course. This presentation will discuss hasty regression and demonstrates why it represents a terrible testing strategy leading to unsubstantiated and false conclusions. A baseline regression includes a dummy variable for the treatment. The hypothesis is that the dummy variable when true (or on, or equal to 1) represents a statistically significant change in the outcome measure of the dependent variable. A simple data set is used to illustrate that the initial insignificant result is dead wrong. And in the end, it has an outsized and positive effect that is superior to alternative specifications. None of this would be known if the analyst stopped after the false signal of that first hasty regression. PROC REG and its TEST statement are used to perform nested Wald-type F-tests. Multiple specifications are shown to each be significant. SGPLOTS of results and residuals help to understand the process. The outcomes follow a quadratic path with no role for the treatment variable or there's a clear structural break because of the treatment. To test one model against the other, non-nested hypothesis testing is used. Ramsey RESET misspecification tests in PROC AUTOREG and regression selection processes within PROC REG are employed.
[The current version of this paper is version 3 and attached as a pdf named Myers-1184-SASGF2021-v3-Hasty_Regression_Proceedings_Paper.pdf]
Watch the presentation
Watch Haste Makes Waste: Don't Ruin Your Reputation With Hasty Regression as presented by the author on the SAS Users YouTube channel.
Regression Analysis: Essential Practice beyond the basics
Regression analysis is like a puddle in which a novice can wade, and an expert drown.
All of us learned regression in some course that we took or some training that we received. In that first course, we were introduced to the very basics of regression. Perhaps that training was less than an entire 15-week course and may have been only a few weeks. One course that I know spends only two weeks on regression while others may spend a full course on it, while still others spend multiple courses and much practice on it. This paper seeks to point out ethical and applied best practices in regression and econometric analysis and to offer guideposts so practitioners may constantly improve and meet the analytical challenges that await them.
To make my point, I introduce a concept and practice that I call Hasty Regression, which is symptomatic of bad practice and not a definition of any particular technique. Hasty regression covers many approaches outside of good practice.[1] In this paper, a temptation that befalls all of us is the anxiousness we have to just run a regression without proper thought in the specification and identification or without regard to the articulation of the problem and the cleanliness of the data. In this paper's example, we wonder if a policy had an effect, so we hastily run a regression throwing in a dummy variable. Just throwing in a dummy variable is the height of bad practice, but from time to time, we all do it.
Especially for academic economists (and other professors), the pressure to publish combined with the publication bias of not publishing insignificant results leads to them discarding potentially good research lines of inquiry because a hasty regression revealed an insignificant correlation when with more work they would have discovered the significant results for which they were hoping. Of course, the opposite is also possible, an initial significant result that fades with more in-depth work. In both cases, the initial result is wrong.
Hasty regression is a useless approach regardless of whether the coefficients are seemingly statistically significant or not. Bottom line, one cannot decide if a project is worthwhile by just running some quick regressions. College professors with the responsibility of directing new students should push against this bad practice and should feel morally bound to guide the research careers of their students in a more scientific direction. Those same professors should also guide students to research causal questions with causal calculus and to avoid causal language when they do not align with that calculus.
Outline of the remainder of this paperThe progression of this paper will continue with calls for best practices in the ethics of applied econometrics and a checklist to help analysts avoid the pitfalls of regression practice. After this general introduction, a specific business problem with sample data is introduced. We begin the analysis with an obvious hasty regression strategy and draw the conclusion that the policy presented does not change the target variable and suggest that the hasty researcher would likely stop their analysis with that conclusion. The paper concludes with processes that lead to the inescapable conclusion that the ineffective policy (from the hasty regressions) is indeed strong and effective.
Ethics Rules in Applied Econometrics and Data ScienceThe tenants of good applied practice beyond the basics are rarely taught in courses for a variety of reasons. First, it takes time to build the mathematical and statistical foundations of standard inference, and not all courses require a mathematical statistics prerequisite making it imperative to cover some of this in the time allotted for the course. Second, it takes time to learn the assumptions of the classical linear model and how to approach all of the problem solutions to autocorrelation, heteroscedasticity, multicollinearity, nonlinearities in variables and parameters, quantitative versus qualitative variables, and right-hand side endogeneity. Again much class, practice, and testing time must focus on technique. Third, classroom testing of the items in the first and second point are easy to derive and grade. Assessment of student's conquering of good principles of model specification is difficult because there is no clear roadmap as there is in calculating the power of a given test statistic.
What is not easy is to teach and judge includes how one (1) articulates the problem, including how to set up an inferential strategy, (2) cleans the data, and (3) specifies the model. These three points are made by Kennedy (2008) in his chapter on Applied Econometrics. Kennedy goes on to point out good practices for applied econometrics, his ten commandments of applied econometrics. In the last half of my 41-year career, I tried to teach and emphasize those rules. I also was invited to express those same rules in an essay for a book on data ethics, Myers (2020). Those rules are listed in Table 1 without explanations. Interested readers are directed to Myers (2020).
Table 1: Ethics Rules in Applied Econometrics and Data Science
Rule 1 2 3 4 5 6 7 8 9 10 | Use common sense and economic reasoning Avoid Type III errors Know the context Inspect the data Keep it sensibly simple Use the intraocular trauma test Understand the costs and benefits of data mining. Be prepared to compromise Do not confuse statistical significance with meaningful magnitude Report a sensitive analysis |
Many professors may shy away from the teaching of these rules because of the reasons listed above, but also because it is hard to teach them. Kennedy (2002) addresses this by saying, "… my opinion is that regardless of teachability, we have a moral obligation to inform students of these rules, and, through suitable assignments, socialize them to incorporate them into the standard operating procedures they follow when doing empirical work.… (I) believe that these rules are far more important than instructors believe and that students at all levels do not accord them the respect they deserve. (Kennedy, 2002, 2008)."
Jennifer Priestley has said "To be an effective and ethical data scientist, you must understand mathematics and statistics. Many data scientists make bad decisions – with ethical implications – not because they are intentionally trying to do harm, but because they do not have an understanding of how the algorithms they are taking responsibility for actually work."[2]
An unethical approach to data analysis is not indicative that the individual is unethical in their person or intention, but rather, through neglect or ignorance, they miss a step that has dire consequences for their conclusions. It is my hope that between following the ethical rules of this section and avoiding the pitfalls in the next section, analytical tragedies may be avoided.
Avoiding the Pitfalls of Regression PracticeI challenged myself to come up with the ten pitfalls of regression practice, in part, as an update to Kennedy, but also to cover what Kennedy did not. Regression can go wrong in many ways, yet give "results" and "test statistics" that lead to erroneous conclusions. Table 2 shows my ten check-items for regression users to think about before starting an analysis, to reference as you work your way through analysis, and certainly before believing the results. As the first sentence of the abstract challenges:
How do you know when your data is lying to you?
Much as a pilot goes through a preflight checklist, econometricians and analytical data scientists should consider the need to preflight their regressions before taking off and only later discovering there is no fuel or an essential part has failed. One phrase that has been used by the data science community is to be data-driven. Taking "data-driven" to mean that you let the data reveal its secrets, one can quickly be drawn to Hasty Regression or hasty Machine learning, or hasty AI. Knowing that data will lie to you is more than understanding your algorithm, although that too is incredibly important (see the Priestley quote above).
Hasty data work is ill-considered problem articulation, insufficient data cleaning, improper data transforms, poorly developed and naive modeling, failure to use common sense, and includes insufficient groundwork for statistical inference. Hasty data work leads to unreliable conclusions, with the only advantage being arrival at an answer quickly. The analyst is much more subject to confirmation bias when sufficient preparatory work has not been done. Hasty data work in the end is very costly!
Table 2: Checklist of the Pitfalls of Regression Practice
| Failure to: | Explanation |
1 | Understand why you are running the regression. | Regression can be used for explanation or prediction, but not both. Proper articulation of the problem being examined must be done before beginning. Regression is not for exploratory data analysis (EDA), and EDA is to be avoided in specifying your regression. |
2 | Be a data skeptic and understand the data generating process. | Economists are said to be obsessed with the data generating process. This comes in large measure from having to use the data we have and not the data we want. The DGP, in actuality, will produce extreme values that challenge us to delete or transform. Important cofounders may be missing, and observations may be missing. What variables actually measure may differ from what the owner says they measure. |
3 | Examine your data before you regress. | It is critical that you fully understand your data. However, EDA has both benefits and costs, and you must learn the difference. Caution that you do not build your model around correlations that you asked for and now cannot un-see. |
4 | Examine your data after you regress. | Examine both predictions and residuals to help gauge the model performance, noting that these and all statistical results in the regression are highly sensitive to model misspecification. Just as perturbations and patterns in the data may hint at a model specification, perturbations and patterns in the residuals can identify the failure of that model. |
5 | Understand how to interpret regression results. | Everyone gets this wrong at times. You must understand the use of calculus derivatives (for metrics) versus the difference in mathematical expectations for binary and categorical variables. For example, a dummy (binary) variable in a semi-log equation cannot be directly interpreted. |
6 | Model both theory and data anomalies and to know the difference. | A variable may be correctly measured yet yield an anonymous result or match a theoretical hypothesis. Knowing the difference is not straightforward and often not the conclusion from a single test. Modeling theory means matching a pattern of statistical testing to the problem at hand while understanding that alternative specifications may seem near equally valid. The rest of this paper focuses primarily on this point. |
7 | Be ethical. | (see Table 1: Ethics Rules in Applied Econometrics and Data Science) |
8 | Provide proper statistical testing. | As mentioned in rule 6, the proper statistical test may not be a single test and likely requires a full-on testing strategy like the problem illustrated later in this paper. |
9 | Properly consider causal calculus. | Economists are especially attuned to causality, but their use of causal calculus is more recent. One must establish not only that if A occurs, then 'B' will occur, but that if 'B' occurs, then 'A' must have occurred. (See Pearl and Mackensie (2018) and Cunningham (2021) for more on the calculus of causality.) |
10 | Meet the assumptions of the classical linear model. | No list of pitfalls can be complete without the proper homage to the assumptions of the CLM. However, regression seems sometimes discarded because the linear model is too limiting. There are techniques to address each violation, and econometric research has continually developed inference to address each of the assumptions. |
The rest of this paper is a look at a particular problem and how a type of hasty regression will lead to a poor conclusion. Specifically, it shows how multiple model specifications of the problem will, if not comprehensively applied, lead to dramatically different and seemingly equally correct solutions.
We take the example of a very simple problem with limited data and no cofounders and see that the resolution is no simple matter. In other words, we can produce multiple good regression results by virtue of their fine summary statistics, but the data seem to support a variety of contradictory conclusions. We set out on an investigation as a tenacious data detective. I remind the reader again to ask, how do you know when your data is lying?
It might seem easy to know the answer or easy to use advanced and automated techniques to answer such a simple question, but below, we find that is not the case. As Pearl and Mackenzie (2018, p. 413) tell us
Data alone can never solve questions of causality.
More explicitly, "In certain circles there is almost a religious faith that we can find the answers to these questions in the data itself, if only we are sufficiently clever at data mining. However, readers of this book will know that this hype is likely to be misguided. The questions I have just asked are all causal, and casual questions can never be answered from data alone. They require us to formulate a model of the process that generates the data, or at least some aspects of that process. Anytime you see a paper or a study that analyzes the data in a model-free way, you can be certain that the output of the study will merely summarize and perhaps transform but not interpret the data. This is not to say that data mining is useless. It may be an essential first step to search for interesting patterns of association and pose more precise interpretive questions… (Pearl and Mackenzie (2018, pp. 413-414)) "
A Business Problem To Illustrate Hasty Versus Good Regression Practices
The problem below is one of causality. While it may be interesting to ask whether there is an association between a policy change and an outcome variable, that alone does not establish causality. This paper does not fully pursue the causality of the problem under study but shows equally that automatic solutions, without the human modeling experience, will not lead to a satisfactory result. In short, this paper establishes whether 'A' causes 'B,' but without completing the loop and showing that 'B' does not occur without 'A' having occurred. Our examination is of a lower rung on the causality ladder, no less important but essential for the fuller story.
Let's suggest that an entity, such as a business or government, has a metric of great interest to their operation. This success metric, denoted as Y, is tracked and recorded once during each period of time. Y could be output produced, number of people served, number of items sold, state domestic product, US gross domestic product, or any other success metric reasonably related to the entity's operation. This is the environment of our business problem.
The entity implemented a policy change seven periods ago and now wonders whether a retrospective examination will show whether it "paid off" in higher values of the success metric. To test this "pay off," we have 14 periods of data, seven years before and seven years after the policy change. These time periods, for example, can be months, quarters, or years.[3]
Articulation of the problemThe first step in any applied analytic approach is to articulate the problem needing to be solved. Only by starting out with a clear statement of the problem can one hope to do all that is possible to solve it. The problem to be solved is this: Did a policy or procedure implemented at the end of the 'before' period of time cause a change in the outcome metric of interest in the 'after' period over and above any naturally occurring change in Y?
Data AcquisitionThe data for this demonstration are in the code block below. There are seven periods before and seven periods after the change in the policy. A PROC MEANS procedure is run to verify the data have been entered correctly. If you type this in, the correct mean and standard deviation is shown in the title statement. The code to load and verify the data is:
Data Y;
    input Y @@;
    datalines;
    12.35  13.71  16.00  17.94  20.76  21.11  24.63
    27.56  32.88  35.16  39.26  44.28  47.27  51.55;
    run;

title 'The correct mean of y is 28.890 and the Std Dev is 12.9719';
proc means data=y mean std maxdec=4;
run;Preparation of the data should involve much work exploring and cleaning the data, but in this illustration, we accept the data as is. In practice, skipping this step will almost always lead to peril.
Data Transformations for AnalysisOur business problem suggests a course of action. The first question to explore is what is the pattern of the data, and how do they trend over time? Are there any obvious characteristics to that data and its trend? Are there significant perturbations in the data, or is it fairly smooth? These and other questions will be addressed below, but it becomes obvious that some variables need to be created or transformed as shown:
Data trdata;
    /* Problem is to explain the trend in variable Y. */
    /*     H0: An intervention that begins in T=8 has no effect on the trend line.*/
    /*     H1: An intervention at T=8 changes the trend line. */
    /* Alternative problem: */
    /*     The actual equation is simply nonlinear in variables such as y = T TSQ.*/
    set Y;
    T=_N_;                      /* 1. create time variable. */
    TSQ = T*T;                 /* 2. and time-squared value. */
    D=0; if T>=8 then D=1;     /* 3. Create binary variable for the intervention. */
    DT = D*T;                  /* 4. create interaction of D and T. */
    run;
Four variables are created to aid the analysis, T which is the linear time measure, and TSQ, which will allow for a suspected quadratic trend. To that, we use dummy variable, D, which is the intervention or treatment variable, and DT, which allows that the influence of D may vary with time, T.[4]
Model SpecificationAfter articulating the problem and cleaning the data should follow the model specification stage of applied econometrics. Much of the contention of this paper is, what if little to no thought and investigation goes into this step. The remainder of the paper takes this up primarily by offering a roadmap—a roadmap of how to think your way through all problems. The roadmap has to include the ten ethics rules and avoiding the ten pitfalls of regression practice, but first, what if it does not?
Hasty Regression as a starting pointWe have data, and we have a question: does D affect Y? So let's run a regression. What could go wrong?
I use the term hasty regression to describe when a researcher quickly runs a regression with minimal or no articulation of the problem, virtually no data cleaning and preparation, a lack of understanding of the data generating process (DGP), or no critical thought on or empirical investigation into the appropriate model specification. Who would do this, you might ask? Nearly all of us. The temptation is just too great. We become anxious about what may be learned, but we can never un-see those initial and hasty regression results which will bias our approach whether the binary variable is significant or not.
Hasty regression is running a model pulled out of the air without regard to the theoretical problem under study and without rigor in the model specification stage, all the while giving no regard to whether the data is clean and ready for analysis.
Mistakes of commission and omission, made in the articulation of the problem and the specification, identification, and selection of the model may prove fatal to your analysis, but the results do not identify as fatal. Indeed they look the same as results from better well-conceived designs. The poorly conceived problem and the undoubtedly misspecified model can lead us to what can only be described as a failure.[5] Further, large t's and F's and a high R-square are not in and of themselves indicative of a good model.
Researchers legitimately use binary or dummy variables to ascertain whether a point or many such points are significant deviations from the overall trend in a linear regression model.
The dummy variable, D, is defined as D=0 for before the intervention and D=1 after the intervention of the policy. We run the following models and test whether D is significant. The use of labels on model and test statement prove to be quite helpful when sifting through copious output. The code for our first models is:
proc       reg data=work.trdata;
           model_1: model y = t;
           model_2: model y = t tsq;
           model_3: model y = t d;
           model_3A: model y = t tsq d;
           title1 'Regression Specifications - full sample' ;
           title2 'Full Sample, T=1,..., 14';
           run;
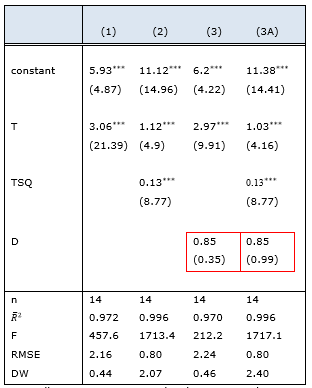
The Hasty Regression is model_3 and the results are shown in column 3 of Table 3. This is likely the first and perhaps the last regression run by the hasty researcher. Model 1 is the base model; the model proffered when the policy variable is not included. Models 2 and 3A emerge as a possibility when residuals from models 1 or 3 are examined, and a quadratic pattern in the residuals is observed.
Table 3: Hasty Regressions with Policy Dummy Variable, D.
(Y is the dependent variable)
Note: All regressions estimated with OLS using the SAS REG procedure. T-stats in parentheses.
*** significant at the .01 level
** significant at the .05 level
* significant at the . 01 level
For purposes of this paper, autocorrelation in this time series is ignored, but DW statistics are shown. Readers may want to experiment with autocorrelation corrections after all these data are a time-series, but the fundamental points being made in this paper do not change with the corrections.
Let's take a look at these results.
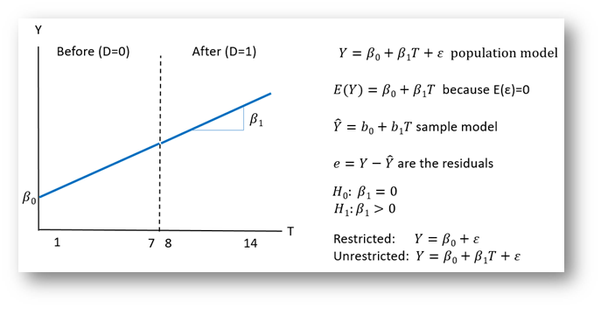
Table 3 shows the parameters estimated for Model_1, which has an adjusted R-squared, , of 0.972 and a RMSE (root mean Squared Error) of 2.16, showing that this seems to be a pretty good representation of the trend of Y. One might be tempted to say that with such low p-values (not shown) that this 'proves' that the regression is linear, but this proves nothing. The t-values and the F statistic for the model show that the variable T is statistically significant based on a null hypothesis that Y is equal to random error. This is hardly confirmation where the 'bar' is T is literally better than nothing. Every test we normally encounter are called nested tests. The tests compare a restricted model to an unrestricted model. The first regression compares the restricted model that Y is a constant to Y is influenced by a time trend. The F-test is the same as the t-test in showing that the slope is zero. This is clearly rejected. This case is shown in Figure 1.
Figure 1: The linear model without regard to the intervention
 The Results of our Hasty Regression: Does D matter?
Model 2 shows that the trend is consistent with a quadratic pattern. This comes from examining the residuals of Module 1, as will be shown later in this paper. Model 3 shows that the effect of D is zero when compared to a linear trend in Model 1, and model 3A shows that the effect of D is zero when compared to a base model that exhibits a quadratic trend.
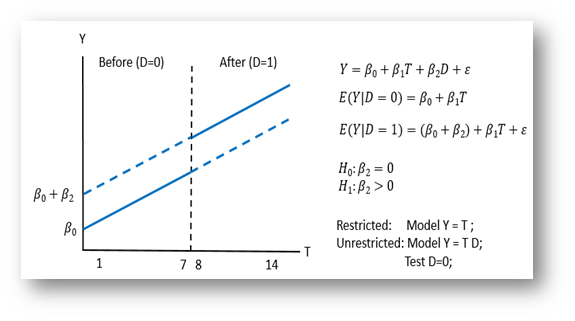
The policy variable, according to the hasty regression, has no effect on our target value. The test in model 3 is very specific, as is illustrated in Figure 2. The test of the hypothesis on D requires that no other variables are in the model and that the slope, the effect of T on Y is held constant and not allowed to change. (A similar figure can be produced to show the same test of shifting intercept holding constant the linear and quadratic terms in T).
Figure 2: Test of an intercept difference holding slopes the same (Model 3)
At this point (either model 3 or 3A), the hasty analyst may conclude that D has no effect on Y and stop their questioning. This is hasty regression at its finest (read sarcasm). By saying that D is unimportant in explaining Y as a general statement, then this is a lie from our data. As we will show, D is far more important than this would imply. Our hasty researcher is on to other tasks, while our better researcher starts this analysis very differently.
Why Hasty Regression Is a Wrong Starting PointHasty regression should never be used. There I said it.
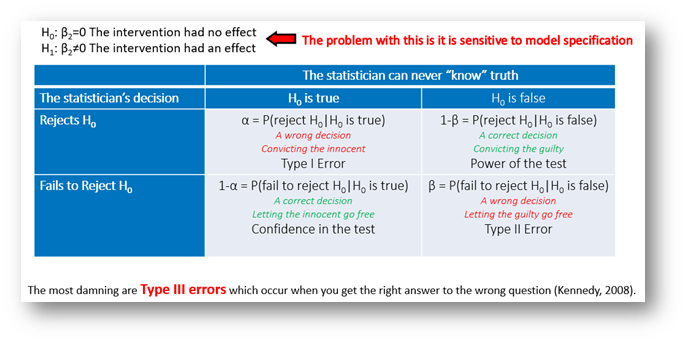
Why do the insignificant results of Models 3 and 3A not prove the policy has no effect? The statistician's dilemma is he or she can never know the truth. What is known is an estimate based on an estimator (formula) given a specific sample data set. The statistician wants to test a hypothesis on an unknown population estimator by using a known sample estimate. Type I errors occur when we reject the null hypothesis, but in reality, the null hypothesis is true. Type II errors have us failing to reject the null hypothesis when indeed, the null hypothesis is false. Figure 3 illustrates this nicely. The green text shows a correct decision and the red text shows a wrong decision. Proof is not possible, ever. Let me say again we can never prove anything because the truth cannot be known, but we use statistics to set the decision criteria for our behavior. What happens when multiple tests point in different directions?
Figure 3: The statistician's decision, to reject or not reject
I used courtroom "testing" as an example in Figure 3. Don't we say that we prove someone's innocence in court? The null hypothesis in court is "innocent," and we say "innocent until proven guilty," but in actuality, we do not prove guilty; we reject the null hypothesis of innocence based on the evidence. In the same way, we do not prove innocence either. We fail to reject their innocence based on a lack of evidence. You can trace through the same courtroom test if the null hypothesis is "guilty until proven innocent."
We can never prove; we can only falsify on the basis of this estimator and this dataset. The best we can do is use the most powerful test based on the best estimators from our best-specified model. In a controlled experiment, we can replicate the experiment and test over and over, but in economics and in the testing of observational events that have historically occurred, there is often, if not always, no replication possible. The history we have is all we have.
The statistical community has called into disuse the declaration of models being significant or not significant based on a crossed threshold by our test. The tables below do show a breakdown by threshold, but in this case, this is for convenience, and the exact p-values in this paper are universally extremely small (very close to 0.00) or quite large (over 0.30).
Dealing with indecisionEvidence! I need more evidence! I am a fan of mystery and thrillers and enjoy the twists and turns of a problem where typically the protagonist is up to their ears in a mystery, and every step frustrates more because it seems that they will never get to the end. But of course, they do, and we will as well. In the words of Fenton Hardy, the fictional father of the Hardy Boys, a series I read religiously a half-century ago, we must "leave no stone unturned."
So what to do? Obviously, time to overturn some stones. That is to dig deeper, to go beyond the obvious as in the hasty regression above.
Our grand hypothesis is about D, or rather about what D is measuring. Did the intervention have an impact on the outcome variable as measured by the Y variable? Three points: First, it is easy to think we are seeking truth from data, but the manner as I write this paper is that data will lie to you. We need to first think of and seek an overall explanation of why D would affect Y and then measure every effect we can think of. Falling short of that means the data may still lead us astray. Second point: tests of statistical hypothesis have three parts, (1) the null hypothesis, which we try to reject, (2) the alternative hypothesis, and (3) the maintained hypothesis that is not subject to test. The latter is indicative that what other variables are in a model and, equally important, what is not in a model affects the restricted/unrestricted tests. Consider models 3 and 3A below, each with the same test of the effect of D. While the null and alternative hypotheses are the same, the maintained hypotheses are different, meaning we may find a failure to reject Test 3 and an ability to reject Test 3A, that is a rejection of Model_3 and a "failure to reject" of Model_3A.
Model_3:  Model Y = T D;
          Test 3: Test D=0;
Model_3A: Model Y = T TSQ D;
          Test 3A: Test D=0;
Analysts need not only develop a modeling and estimation strategy but must have a testing strategy to answer the overall question. In this simple case of this paper, I show that it takes eight separate tests to answer one grand hypothesis. No single equation answers the question until we have rejected all other competitors.
Model selection and specification versus being Data-DrivenSome analytic approaches start with the idea that the truth is in the data and what is revealed is true, but the premise of this paper is that data can and does "lie" or greatly mislead. Some think that being data-driven will yield the best results, but being theory-driven is far more important. The art of model specification requires we consider theory and common sense as we begin our process and that we validate our data by inspecting it before we regress, that we learn about the DGP. In this case, the DGP strongly suggests that the growth in Y is quadratic or linear when allowing for a structural break based on the value of D.
Those that start out with hasty regression may compound the problem by running variations of the original hasty regression to try to get a better fit. These additional equations are based on an initial set of results that may have already lied to them. Building a better model on a shaky foundation is not good building practice. Better to start over (but you have already been contaminated by seeing the correlations), but it is best to start with a firm foundation in the first place.
A data scientist and former econometric student of mine said that when his team is given a new problem, he puts them in a conference room and asks them to formulate and solve the problem before he allows them to see the data. In this manner, his team can never run a hasty regression or a hasty machine learning model. I asked if this was from his econometric training, and he said 100%. When his team begins their investigation of a new problem, considerable thought has already gone into that process. I think this is one of many competing ways to make sure that much human thought goes into the specification process.
A data-driven technique-only approach invites anomalies to rear their ugly head and suggest a finding where it is not there. Likewise, a data-driven approach to over-clean the data and transform it has the effect of removing meaningful perturbations in the data by assuming they are just anomalies to be flattened.
As attributed (correctly or incorrectly) to Nobel Laureate Ronald Coase: "If you torture the data long enough, it will confess." Of course, the tormentor will stop the beating when their biases are confirmed. We have all seen the TV drama of a torturer beating an innocent person because the (wrongly) expected truth fails to emerge. If all you want to do is to confirm your expected solution, then why do the data work at all? And if you are willing to let the data speak for itself without much or any human thought intervention, then why think at all?
quantitative and qualitative variables Require Different ApproachesThe values Y and T and TSQ are quantitative. The binary class variable, D, is qualitative (categorical) with a value of zero for the first seven periods (called 'before') and a value of 1 for the last seven periods (called 'after'). While D is indeed qualitative, because of the 0, 1 coding, it has desirable quantitative properties, chiefly among these is the mean is the portion of observations 'after' when compared to the total sample.
Mathematically the treatment of RHS quantitative and qualitative variables are quite different.
Let's begin with Model 1 shown in equation 1. For the purposes of this paper, this is our starting point. Models 2, 3, and 4 are all extensions to that model and can each be tested to see if they differ from the linear model.
Model 1, linear | 1 |
When we use binary or categorical variables on the right-hand side of the regression equation, we have to treat them very differently than quantitative or metric variables. Take two equations that are quite different.
Model 2, quadratic
| 2 | |
Model 4, structural break | 3 |
T is quantitative, and the interpretation of the effect of T on Y in equations 2 and 3 is the partial derivative of Y with respect to T, which differs because of the different specifications. In the quadratic model, the estimate of the effect of T on Y is a function of T, and in the structural break equation, the effect of T on Y is a function of D and thus one of two values, β1 in the before period where D=0 and β1+β3 in the after period where D=1.
| 4 | |
| 5 |
I show this not to introduce calculus into the paper for effect, but rather to say the effect of the variation in T on the variance of Y is an easily notable math equation because T is quantitative. No such partial derivative exists when discussing the effect of D on Y. Partial derivatives represent small changes of the numerator variable, and small changes are not possible in D, either D=0 or D=1.
To estimate the effect of D on Y, we use the mathematical expectation of the difference in regressions between the two cases: the state of D=0 and the state of D=1. Equations 6 and 7 show the calculations of the two states, and the difference, which is the effect of the dummy variable on Y is shown in equation 8. These differences in expectation are derived from model 4 only since model 2 does not include the dummy variable. Substitution of D=0 in equation 6 and D=1 in equation 7 is shown in red.
| 6 | |
| 7 | |
| 8 |
Therefore to test the effect of D on Y in model 4 we can certainly judge t-tests on the separate parameters in equation 7, but the most accurate test is executed as shown in this code block:
proc       reg data=work.trdata;
           model_4: model y = T D DT;
           test_4:  test D=DT=0;
           title1 'Regression Specifications - full sample' ;
           title2 'Full Sample, T=1,..., 14';
           run;
The test of H0: β2= β3 = 0 in Model 4 as expressed in equation 3 is characterized in the code block as test D=DT=0, and that yields a Wald test testing the unrestricted model of equation 3 against the null hypothesis that Y is simply linear in T (model 1).
A better starting pointA cursory inspection of the data would (or should) prevent a hasty regression like Model 3 from being run. Let's think our way through the modeling process.
First Look: Is The Base Model Linear?Equation 1 is the base model for this investigation, and we are about to visualize and estimate it. The base model for a problem like this one is the best model to explain the variance in the dependent variable without regard to the policy variable of interest. In our simple example, T (our time trend variable) is the only variable in our dataset that will affect Y except for variables derived from D. So we want to establish the 'best' model before invoking D, because the right way to look at D, is does it offer additional explanatory power over and above the best model we can produce without regard to D.
If there were more variables in this example that affected Y, then our first task would be to create the best model specification, including all relevant variables.
Visualization, especially, in this case, can help us learn much about our data. Figure 4 shows the estimated linear regression line surrounded by its confidence interval, and the individual or actual observations are shown as well.
Here is the PROC SGPLOT code to create Figure 4:
ods graphics on / noborder width=5in;
%let xref = %str(xaxis values=(1 to 14 by 1); refline 7.5 /
axis=x label="<-- Policy change" labelloc=inside labelpos=min ;);

title1 'Model 1: Y follows a Linear Trend.';
title2 'PROC SGPLOT with REG Statement.';
PROC SGPLOT data=trdata ;
    reg x=T y=Y / CLM CLI ;
    &xref;
    run;
The first three lines of the code assure graphics are on and the macro token &xref is defined as a common setting for all X-axis in the following graphs.
Figure 4: Explore the trend of the metric Y
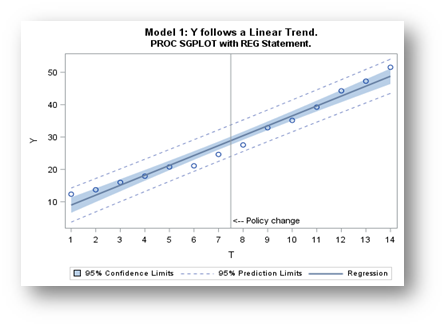
Figure 4 suggests that the regression line is possibly linear but that at least five residuals are large enough to be outside the 95% confidence interval. The points from the scatter also look like they may be quadratic. The pattern of residuals (vertical differences between the actual observations and the line plotted in Figure 4 not shown) show a strong "U" pattern where at low and high values of T the residuals are positive while in the middle of the series the residuals are negative.
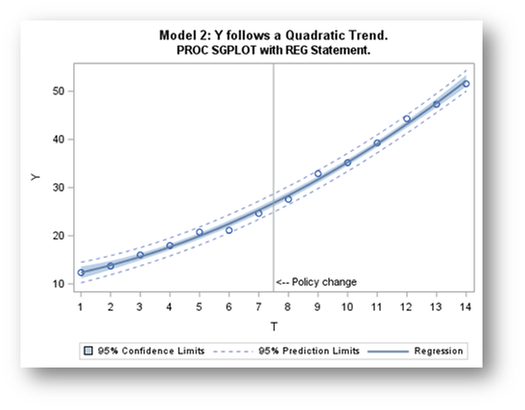
First Look: Is it quadratic?Change the last code to add degree=2 as an option to the PROC SGPLOT reg command. The default is degree=1 and plots the regression of Y on X as in Figure 1, while a change to degree=2 plots Y as a quadratic in T. The code is:
title1 'Model 2: Y follows a Quadratic Trend.';
title2 'PROC SGPLOT with REG Statement.';
PROC SGPLOT data=trdata ;
    reg x=T y=Y / degree=2 CLM CLI ;
    &xref;
    run;
The result of this change is shown in Figure 5 and rather clearly suggests that the trend in Y may be quadratic and have little to do with the intervention, D.
Figure 5: Y as a quadratic function of T
 First look: A nonparametric look at the trend.
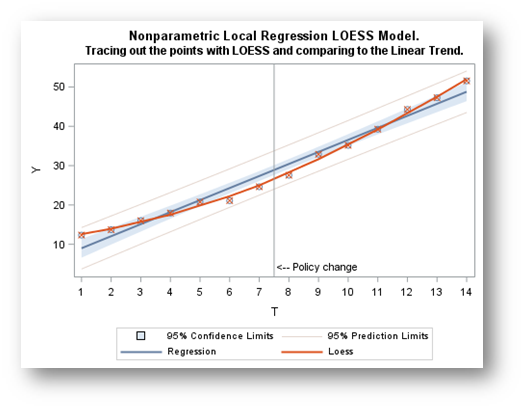
What if we do not impose either a linear or quadratic form on the trend in Y, but rather use a nonparametric technique invoked by the PROC SGPLOT command LOESS to trace out the most obvious pattern. The LOESS is a nonparametric regression, also called local regression, that will trace out the scatter points by running a regression only among the nearest neighbors to each data point.[6] That way, the many regressions run are not sensitive to points far away from the point of interest. In the loess command, we can choose cubic or linear, and each with a degree of one or two. You can run all four combinations and see that, in this case, the lines look the same for each combination.
Next, we graph the linear reg plot (changing the code from last time to degree=1 and causing it to be somewhat transparent) and the loess plot drawn over the reg plot. The code is:
title1 'Nonparametric Local Regression LOESS Model.';
title2 'Tracing out the points with LOESS and comparing to the Linear Trend.';
PROC SGPLOT data=trData;
    reg x=T y=Y / degree=1 CLM CLI CLMTRANSPARENCY=.5;
    loess x=T y=Y /interpolation=linear degree=2;
    &xref;
    run;
Figure 6 shows that the loess plot seems to trace out a fairly definite quadratic-looking relationship and in this case, the scatter seems to show points closer to the quadratic than the linear. This is another lie in this data, but we have to finish the analysis to know that!
Figure 6: What does a nonparametric trend reveal?
How does the trend look separately by group?
Since our interest is before and after the midpoint of the data, that is, did the intervention, D, affect the trend, we turn again to linear regression and apply it separately by group, before (D=0) and after (D=1). For this visual, we modify the code to overlay the before and after regressions on top of the full-sample linear regression. The group=D option on the second reg plot instructs the plot to plot first the observations with D=0 and then the last observations with D=1. The code now looks like this:
title1 'Model 4: Structural Break with Linear Trend by Group=D';
title2 'Separate linear regressions before and after policy change';
PROC SGPLOT data=trdata;
    reg x=T y=Y / CLM CLI CLMTRANSPARENCY=.5;
    reg x=T y=Y / CLM CLI CLMTRANSPARENCY=.25 group=D
                 markerattrs=(symbol=circlefilled color=black size=10px);
    &xref;
run;
Figure 7: What does the regression look like before and after the intervention?
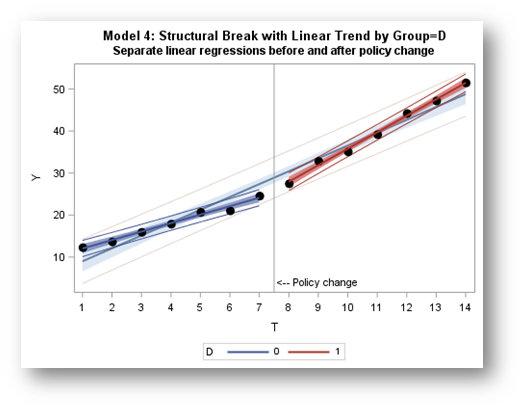
It seems obvious from Figure 7 that there is a different trend line before (blue line) and after (red line). This suggests that there is strong evidence that the trend is consistent with a structural break and that D has a strong influence.
Does the trend appear quadratic, before and after?The local regression in Figure 6 traced out a strong looking quadratic relationship, and that was said to be a lie in the data. To see why we can visualize the local regression of the last seven periods separately from the first seven periods to get a feel if the separate periods (groups) are more linear such as in Figure 7 or more likely due to a natural quadratic-like relationship as in Figure 5. The following code will overlay the full-sample linear trend with the local regressions in the before and after time-slice of the full sample:
title1 'Local regression by group=D';
title2 'Separate LOESS regressions before and after policy change';
PROC SGPLOT data=trData;
    reg x=T y=Y / CLM CLI CLMTRANSPARENCY=.5;
    loess x=T y=Y / group=D interpolation=linear degree=1
                       markerattrs=(symbol=circlefilled color=black size=10px)
                       CLMTRANSPARENCY=.25;
    &xref;
run;
Our result in Figure 8 is that the quadratic relationship visualized over the entire sample seemingly vanishes when each group is analyzed separately. But of course, we have only beat the data a little so far, and this confession seems pretty weak. Like much analysis, we have dug into the data but have not yet confirmed our assertions using statistical inference. We turn to that next.
Figure 8: What do the separate trends by D look like?
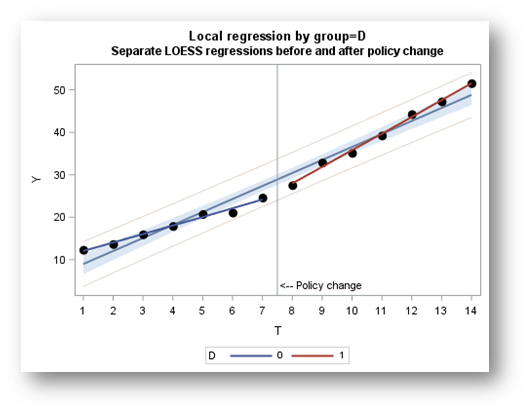
Summary of the visual analysis
Visual evidence for a quadratic trend and a structural break is found with the structural break model having more credence because the before and after periods exhibit no quadratic form and appear linear. Now we turn to quantitative this relationship.
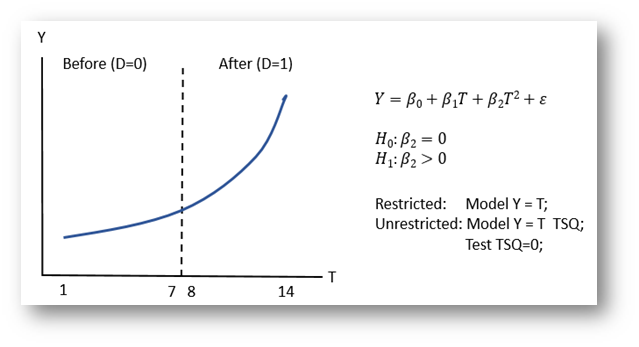
Regression Specification Testing: Did a Structural Change occur or is it a Natural Quadratic Progression?In the visual inspection of the data in part 1, two possible models emerge, one called a structural break model where D is quite important (see Figure 9) and a quadratic model where D is likely unimportant (see Figure 10).
Figure 9: Test of changing intercept and changing slope by the intervention, D.
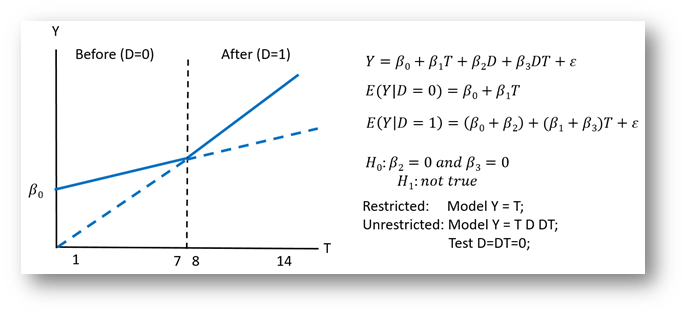
Figure 10: Alternate model, test of a quadratic form
The following code block sets up the full set of regressions and tests needed for this investigation in a linear regression format. The results of the first PROC REG are shown in Table 4, and the results of the second set of PROC REGS based on the WHERE command of D=0 and D=1 are shown in Table 5.
Title1 'Statistical models';
proc       reg data=work.trdata;
           model_1: model Y = T      ;
           model_2: model Y = T TSQ  ;             /* Quadratic Model  */
           model_3: model Y = T D    ;             /* Hasty model      */
           model_4: model Y = T D DT ;             /* Structural Break */
           title2 'Full Sample, T=1,..., 14';
           run;
proc       reg data=work.trdata;
           model_5: model Y = T      ;
           model_6: model Y = T TSQ  ;
           title2 'Partial Sample, T=1,...,7 Before';
           where D=0;;
           run;

proc       reg data=work.trdata;
           model_7: model Y = T      ;
           model_8: model Y = T TSQ  ;
           title2 'Partial Sample, T=8,...,14 After';
           where D=1;
           run;
quit;
Table 4 shows every adjusted R-square term is very high and close to 1, and RMSE are all low, but the quadratic and structural break models stand out the most, with the structural break model edging out the quadratic model with adjusted R2 of .998 > .996 for the quadratic model, hardly a significant difference. Also, the structural break model has a lower RMSE of 0.65 <0.80 for the quadratic model. Nevertheless, both models appear quite strong, and while both reject the linear model, there is at this point no test of the difference between the two.
Table 4: Full Sample Statistical Models (Y is the dependent variable)
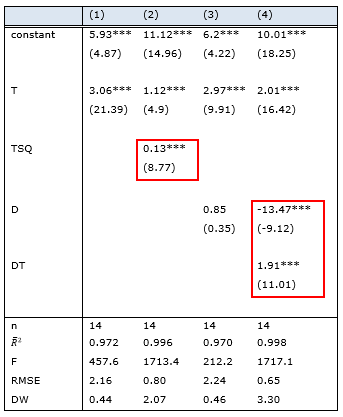
Note: All regressions estimated with OLS using the SAS REG procedure. T-stats in parentheses.
*** significant at the .01 level
** significant at the .05 level
* significant at the . 01 level
In testing both models against the linear base model, we see that unfortunately, both models 2 and 4 reject the null hypothesis or restricted model of Model 1. The test statements generate Wald-type F-tests of a restricted versus an unrestricted model. These are known as nested tests since one fits in the other by a model reduction when the null hypothesis is applied. In the quadratic case, the F test is the square of the t-stat on the single parameter by a well-known theorem. In the structural break case, the Wald test differs from the two separate parameters test. Let's run the following code:
title2 'Testing the Quadratic Model against the Linear Model';
proc reg data=trdata;
 model_2:     model Y = T  TSQ;
 Quadratic:   test tsq=0;
 run;

title2 'Testing the Structural Break model against the Linear Model';
proc reg data=trdata;
 model_4:           model Y = T  D  DT;
 Structural_break:  test D=DT=0;
 run;
As a result, we are presented with two test results, each asking whether the model (quadratic or structural break) rejects the linear model, Model 1.
Figure 11: Both the Quadratic and Structural Break models are "acceptable."
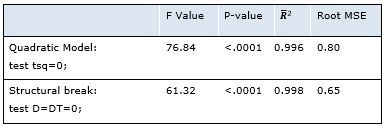
The results are explicit. Both the quadratic model and the structural break model reject the linear model. If we agree that the word "acceptable" is not proof of truth because it is not, then here is the problem in a nutshell: Both models are "acceptable." The quadratic model says D has no effect and the structural break model says D has a large and positive effect.
Are we done? Is that it? Hardly. Read on.
Based on the visual analysis of Figure 7 and Figure 8, Table 5 shows a way to further examine the two models. If the quadratic model holds in the full sample, it must likewise hold in the before and after samples. Models 5 and 7 show strong linear models which have higher adjusted R2s and lower RMSE scores than the quadratic models 6 and 8. Indeed the addition of TSQ to the linear model is not significantly different from zero. Hence the linear model superiority on the full model is confirmed in each of the segments of time, before and after. Linear in each the before and after time periods is consistent with the structural break model.[7]
Nevertheless, this still is not the best test between the two.
Table 5: Before and After Regressions (Y is the dependent variable)
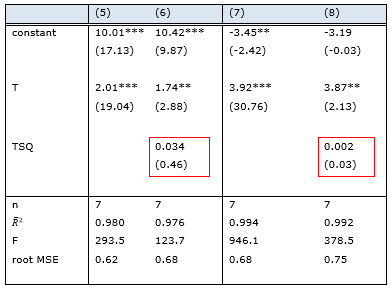
Note: All regressions estimated with OLS using the SAS REG procedure. T-stats in parentheses.
*** significant at the .01 level
** significant at the .05 level
* significant at the .01 level
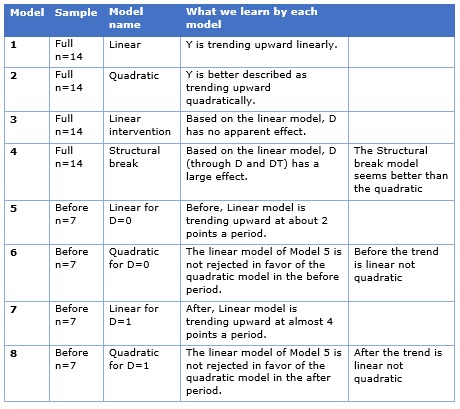
Table 6: Summary of all eight statistical models
 What of automatic model selection?
PROC REG has seven automatic selection criteria for right-hand variable selection using the Selection= option.
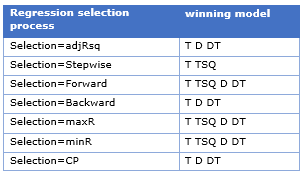
Before we go on to a test of the structural break model versus the quadratic model directly, let's consider an alternative manner of selecting the models. Table 7 shows the results of using the powerful features in PROC REG to automatically choose variables for the model. The choice is based on criteria explained in the SAS Documentation for PROC REG and, in some cases, betrayed by the name of the selection option. The data of this paper were subjected to all seven methods of automatic selection, and the results show the structural break model in three cases, the quadratic model in 1 case, and all of the variables in the data 3 times. That is, the revealed model by the "black box" of selection is totally dependent on which selection method is used. Obviously, this is not a superior solution to reveal the truth of the data as we know it.
Table 7: Use of automatic model selection in PROC REG
 Using a specification test
Another approach and highly recommended is to subject our models to a Ramsey Specification Test (see Ramsey (1969)). This tests whether there is any additional information in higher-order polynomials of the fitted Y values when added to the model being tested for misspecification. The test is whether there are any nonlinear terms not picked up in the linear expression. The SAS code follows, and it is worth noting that this test is available only in the SAS/ETS PROC AUTOREG.
PROC autoreg data=trdata;
 model_1: model y = T  / reset;
     run;

PROC autoreg data=trdata;
     model_2: model y = T TSQ/ reset;
     run;

PROC autoreg data=trdata;
    model_3: model y = T D / reset;
    run;

PROC autoreg data=trdata;
    model_4: model y = T D DT/ reset ;
    run;
The reset option produces estimates of these higher order polynomials (power 2=squared, 3=cubic, 4=quadratic) and tests whether they are significant. The results for all four models are shown in Table 8 and indicate that both the structural and quadratic models seem to be successful, while the linear and hasty regression are rejected.
Table 8: Ramsey Specification Tests Results (SAS/ETS PROC AUTOREG)
 Non-nested hypothesis testing: Quadratic versus structural break model
Both the visual analysis and the statistical-inference analysis lead to the conclusion that the model of a structural break and the implication that D has a large influence is a better model. Still, as shown by the tests reported in Figure 11 and Table 8, both models are "acceptable." How can we redress this? Which one is actually the better model?
The models of structural break and quadratic have not been tested directly, but rather they have been tested as to whether they are better than the linear. Looking beyond the structural break "win," by the logic above, we turn to test whether the two models are actually statistically different from each other.
To test whether the quadratic model and the structural model are significantly different, we evoke a non-nested hypothesis test. It is non-nested since the models are different, and one does not fit inside (or nest within) the other. That is, there is no model we can run (either Model_2 or Model_4) that will allow linear restrictions on the parameters of one to reveal the other. Notice every test above in this paper is a nested test.
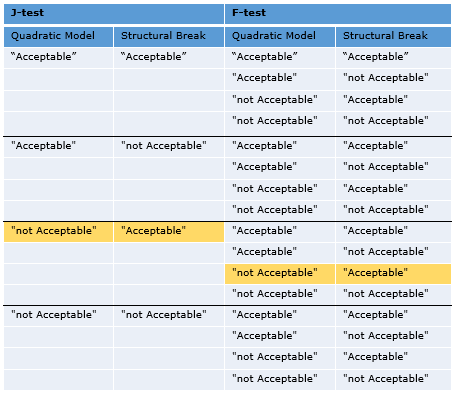
Two tests can be run on the two alternative models, the variance encompassing J-test and the mean encompassing F-test as described in Kennedy (2008) with appropriate references.[8] Together the variance and mean encompassing tests make up the complete encompassing test and has 16 possible results (as shown in Table 10). Each test, the J-test, and the F-test, have four possibilities: Neither model is acceptable, Both models are acceptable, and model A is acceptable, and B is not, or model B is acceptable, and A is not.
These are the desired null and alternative hypotheses:

The following code block shows the non-nested tests, first for the J-test and then followed by the non-nested F-test. The J-test starts with estimating the quadratic and the structural break model and outputting the predicted values of each model. Then the prediction of one model is added as an explanatory variable of the second model. If the parameter of that new variable, the prediction from the other model, is significant, then the model being estimated is rejected.
In the case of the F-test, a supermodel of all the variables is formed with Wald-type TEST statements to reduce the supermodel to the model being tested. If the Wald test is significant, then the model is rejected.
The code shown uses PROC REG and parallels the mathematics of the non-nested hypotheses test for both the J-test, known as the variance-encompassing test, and the F-test, known as the mean encompassing test. The J-test utilizes a t-test on the predicted Y variable from the other model, so there are two tests to look at in the J-test. The mean encompassing test builds a supermodel of all of the variables in both models. Then by exclusionary restriction proffers two tests as one set of exclusions reduces to the first model and the other set of restrictions lead to the second model. So there are a total of two possible t-tests and two possible F-tests. This leads to 16 possibilities: two t's, two F's and two outcomes (rejected or fail to reject) and are shown in Table 10.
Here is the code for doing the non-nested hypotheses test.
Title1 'Non-nested hypothesis - J-test';
Title2 ‘Variance encompassing test’;
Proc reg data=trdata;
     model_2: model Y = T TSQ;
     output out=Mquad p=Yquadhat;
     run;

Proc reg data=trdata;
     model_4: model Y = T D DT;
     output out=Minter p=Yinterhat;
     run;

Proc reg data=mquad;
    model_4A: model Y = T D DT Yquadhat;
    run;

Proc reg data=Minter;
    model_2A: model Y = T TSQ Yinterhat;
    run;

Title1 'Non-nested hypothesis test - super model, F-test';
Title2 ‘Mean encompassing test’;
Proc reg data=trdata;
    Super: model Y = T TSQ D DT ;
    quadratic: test TSQ = 0;
    structural_shift: test D =DT=0;
   run;
The results of the four tests are highlighted in Table 9 and with explanatory call out blocks to help reduce the confusion of all that is going on here.
Table 9: Non-nested Hypotheses Testing
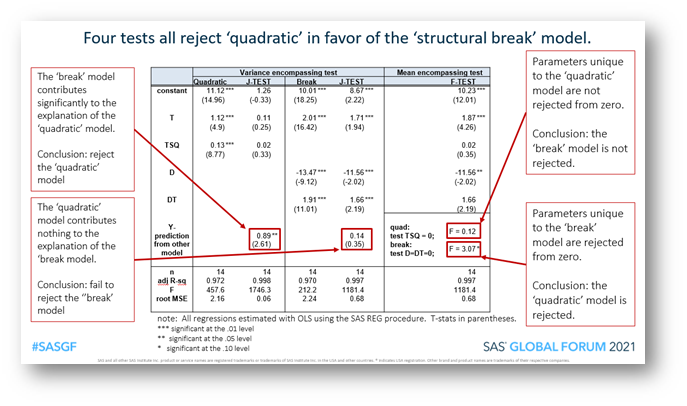 J-test – the variance encompassing test
Table 9 shows that the predictions from the structural break model (column 2 j-test highlighted) are significant and thus contribute additional explanatory power to the quadratic model and therefore rejects the quadratic model. Also shown is the predictions from the quadratic model (column 4 j-test highlighted) fail to reach significance and thus do not contribute additional explanatory power to the structural break model and therefore fails to reject (finds "acceptable") the structural break model.
F-test – the mean encompassing testWhen a supermodel of all variables from the structural break model and the quadratic model combined, the variables unique to the quadratic model fails to reject the null hypothesis of zero effect. So the quadratic model is not acceptable. However, the unique variables to the structural break model do contribute to the explanatory power over and above the quadratic model, meaning the structural break model is not rejected (found "acceptable").
J-test and F-test together – the complete encompassing testAs highlighted in Table 10, the J and F non-nested hypothesis tests both agree that the only model "acceptable" is the structural break model; therefore, the intervention as measured by D did have an effect. This is not a guaranteed outcome. Because all of the tests line up to reject the quadratic and support the structural break, we can be very confident in this conclusion. However, in general, these results can conflict, rejecting both or failing to reject both.
Table 10: Sixteen possible outcomes from the complete encompassing test for Non-Nested Hypotheses (with results of this paper highlighted)
Conclusion
This paper has attempted to take on the bad practices of Hasty Regression and, indeed, by implication, every application of regression-type strategies that violate the ethical practices and fall into the pitfalls of regression practice. What is missing throughout all hasty strategies is the lack of serious thought in articulating the problem, cleaning the data, and specifying the model. This paper seeks to show the amount of work that goes into thinking about the model specification. Readers will be able to think of many different ways to attack the problem within and are encouraged to think of different strategies. The operative word is “think.” The more thinking that goes into the process, the better for all our analysis.
As to our example of a causal effect on a trending variable, visually, we liked two models on the entire sample, and only the linear model emerged on the sub-samples.
We showed that a Hasty Regression led to a false conclusion, namely that D did not matter. Not only did D have no effect in Model Y = T D; it also has no effect in Model Y = T TSQ D. This was the biggest lie in the data. Hasty regression lies to you whether you assume a base linear or nonlinear model in time.
Eight regressions were necessary to complete a testing strategy that convinced us that the structural break model was a better representation of the data. A structural break model that breaks on D shows that D is very important to the data.
A Ramsey test for misspecification was run on all models and found the structural break and quadratic models both "acceptable."
The 'quadratic model' was tested against the 'structural break' model directly by the use of non-nested hypotheses: four tests were run, and in each case, the 'quadratic model' was found lacking.
Finally, automatic processes may arrive at the same conclusion, but that is not at all clear. The seven selection features of PROC REG did not all point to the same model and instead gave quite mixed results.
Most importantly, this paper suggests that human critical thinking processes are critical for making sense of this data. Our overall conclusion, data alone cannot solve casual questions.
ReferencesCunningham, Scott. (2021) Causal Inference: The Mixtape. Yale University Press, 570p. Available at https://mixtape.scunning.com/.
Davidson and Mackinnon (1981). "Several Tests for Model Specification in the Presence of Alternative Hypotheses," Econometrica, 49, 781-793.
Kennedy, Peter. (2008), A Guide to Econometrics, 6th edition, Blackwell Publishing.
Kennedy, Peter E. (2002) "Sinning in the Basement: What are the rules? The Ten Commandments of Applied Econometrics." Applied Econometrics, Blackwell Publishers Ltd.
Mizon, G. and Richard, J. F. (1986). The encompassing principle and its applications to testing non-nested hypothesis. Econometrica 3, 657–78
Myers, Steven C. (2020). "Ethics Rules in Applied Econometrics and Data Science," Essay 85, Policy Implications, in Bill Franks (ed.). 97 Things About Ethics Everyone in Data Science Should Know. O'Reilly, pp. 231-233.
Myers, Steven C. (2020). "Show Me the Money! Preparing Economics Students for Data Science Careers" Proceedings of the SAS Global Forum 2020 conference, Virtual, SAS Institute. Available at https://www.sas.com/content/dam/SAS/support/en/sas-global-forum-proceedings/2020/4705-2020.pdf.
O'Neil, Cathy. (2013). On Being a Data Skeptic, O'Riley Media, Inc. ISBN: 9781449374310,
Pearl, Judea and Mackensie. (2018). The Book of Why. Basic Books, 423 p.
Priestley, Jennifer (2019). The Good, The Bad, and The Creepy: Why Data Scientists Need to Understand Ethics, a video presentation to the 2019 SAS Global Forum, posted May 22, 2019 and accessed at https://youtu.be/AnU0hm7uA_k.
Ramsey (1969) "Tests for Specification Errors in Classical Linear Least Squares Analysis." Journal of the Royal Statistical Association, Series B, 71, 350–371.
Selukar, Rajesh. (2009). Structural Analysis of Time Series Using the SAS/ETS® UCM Procedure. SAS Global Forum. Paper 306-2009. Accessed at https://support.sas.com/resources/papers/proceedings09/306-2009.pdf.
ACKNOWLEDGMENTSThanks to Sergey Iglov, my SAS GF Paper coordinator, for his support and patience. Also, I want to thank Dr. Ali Enami of the University of Akron for reading and commenting on the introduction. This paper is the result of three different works that started in 2019. I want to thank all those who helped in the formation of each of the three works. I want to especially thank Dr. Jennifer Priestly for her discussions on ethics and for recommending that I pursue the ethics part of this paper. Thanks to Bill Franks for inviting me to participate and including my essay in his edited volume on ethics. The pitfalls were put together for Ohio SUG, and I want to thank Mary MacDonald and others on the committee for asking me to speak in their summer series. A special thanks to Dr. Murtaza Haider for having me present the pitfalls paper to his Advanced Data Analytics in Business class at Ryerson University. Thanks also to Kirk Paul Lafler for inviting me to present a HOW session on regression at the 2019 SCSUG Educational Forum and for his encouragement. And my thanks to Dr. Joni Shreve, the Academic Chair of SCSUG, for great discussions with her and her students to help refine my thoughts. I am always grateful to Josh Horstman for his help in thinking through some issues, his help with my code when I am stuck, and his general support for presenting and training at SAS conferences.
Recommended ReadingCalise, Archie J. and Joseph Earley (2006) Detecting Structural Change Using SAS®/ETS Procedures. Poster Session, WUSS. Accessed at https://www.lexjansen.com/wuss/2006/posters/POS-Calise.pdf.
Fan, J. and Gijbels, I. (1996) Local Polynomial Modelling and Its Applications. Chapman and Hall, London.
Horstman, Joshua M. (2018) Getting Started with the SGPLOT Procedure, SCSUG. Accessed at https://www.lexjansen.com/scsug/2018/Horstman_SCSUG2018_Getting_Started_With_SGPLOT.pdf.
Horstman, Joshua M. (2018) Doing More with the SGPLOT Procedure, SESUG Paper 205-2018 Accessed at https://www.lexjansen.com/sesug/2018/SESUG2018_Paper-205_Final_PDF.pdf.
Selukar, Rajesh (2017) Detecting and Adjusting Structural Breaks in Time Series and Panel Data Using the SSM Procedure, Paper SAS456-2017, SAS Global Forum. Accessed at https://www.lexjansen.com/wuss/2006/posters/POS-Calise.pdf.
Bilenas, Jonas V. (2014) Scatter Plot smoothing using PROC LOESS and Restricted Cubic Splines, Paper 1503-2014, SAS Global Forum, Accessed at https://support.sas.com/resources/papers/proceedings14/1503-2014.pdf.
Contact InformationYour comments and questions are valued and encouraged. Contact the author at:
Steven C. Myers
https://www.linkedin.com/in/stevencmyers/
SAS and all other SAS Institute Inc. product or service names are registered trademarks or trademarks of SAS Institute Inc. in the USA and other countries. ® indicates USA registration.
Other brand and product names are trademarks of their respective companies.
[1] Not every deviation from good practice is considered hasty regression, e.g., p-hacking would have to be included in such a list. Imagine the young economists or analysts who rush to run a regression using whatever data they can get their hands on and drop the project the moment the results turn out to be insignificant because of publication bias against insignificant results.
[2] Phone conversation with the author, September 4, 2019. See Priestley (2019) for similar comments in her 2019 SAS Global Forum presentation.
[3] While this problem is set in a time-series framework, the concepts of this paper will apply equally well to treatments in a common sample, that is whether the subsample that received the treatment are substantially better off than the subsample that did not get the treatment.
[4] In this example there are no other possible confounders, no other variables to acquire. This is never the case in real analytical scenarios and serves well here for this particular example.
[5] Susan Athey has remarked that some researchers act as if their model was given to them by God. This could be from lack of transparency of their model building process or evidence of a hasty regression approach.
[6] A high-level look at Loess is found at https://en.wikipedia.org/wiki/Local_regression. See recommended readings for more.
[7] I acknowledge a potential degree of freedom problem in these very small sample regressions, but would point out that the two highlighted coefficients are themselves very small suggesting that is not a problem here.
[8] The J-test as implemented here is found in the ETS documentation, accessed at https://support.sas.com/rnd/app/ets/examples/spec/index.htm. Kennedy (2008, pp. 87-88, gives a clear description). Mizon and Richard (1986) discuss the encompassing tests in detail.
Ready to join fellow brilliant minds for the SAS Hackathon?
Build your skills. Make connections. Enjoy creative freedom. Maybe change the world. Registration is now open through August 30th. Visit the SAS Hackathon homepage.
Register today! Click image to register for webinar
Classroom Training Available!
Select SAS Training centers are offering in-person courses. View upcoming courses for:
