- Home
- /
- Programming
- /
- Graphics
- /
- Re: SGPLOT legend order
- RSS Feed
- Mark Topic as New
- Mark Topic as Read
- Float this Topic for Current User
- Bookmark
- Subscribe
- Mute
- Printer Friendly Page

- Mark as New
- Bookmark
- Subscribe
- Mute
- RSS Feed
- Permalink
- Report Inappropriate Content
I think I already know the answer to this but thought I would ask just in case I'm missing something obvious or a new option in 9.4 that I have missed.
Using SGPLOT (9.4 M02), for stacked vertical bar charts there seems to be no (easy) way of getting the legend entries to be in the same visual order (top to bottom or bottom to top) as the stacks themselves, using a numeric variable with formats applied for the stacks.
Unfortunately, the default order of legend entries when the entries are going down, is the opposite to the (visual) order of the stacks. This is a shame as it seems the opposite of good graphing principles. I am in Australia though so maybe having the legend entries the way we need in our publications is an upside down Southern hemisphere thing 🙂
To enable us to meaningfully order stacks in stacked vertical bar charts, we always use a numeric group variable, with format applied to get the legend entry texts. After all how often is alphabetical order really meaningful?
Default: With a stack variable with values 1 to 4 the stacks go UP from 1 to 4 but the legend entries appear in the opposite order going DOWN from 1 to 4.
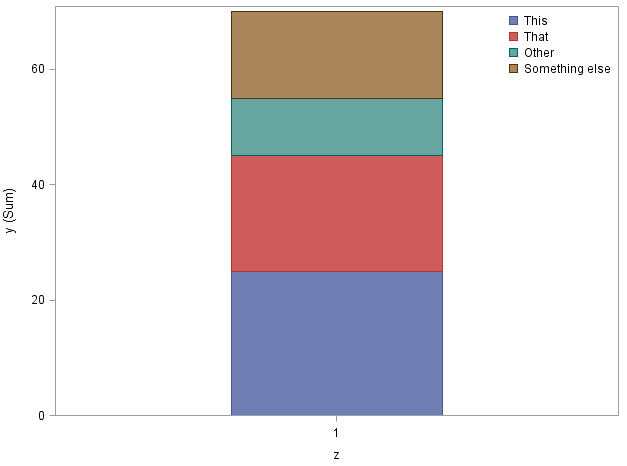
GROUPORDER: If we change GROUPORDER to descending in the VBAR statement, the stacks go DOWN from 1 to 4, but the legend entries go UP from 1 to 4.
Some very simple code to illustrate what happens when we use both descending order options on VBAR and KEYLEGEND:
data temp;
z=1; x=1; y=20; output;
x=2; y=25; output;
x=3; y=10; output;
x=4; y=15; output;
run;
proc format;
value xfmt
1='This'
2='That'
3='Other'
4='Something else';
run;
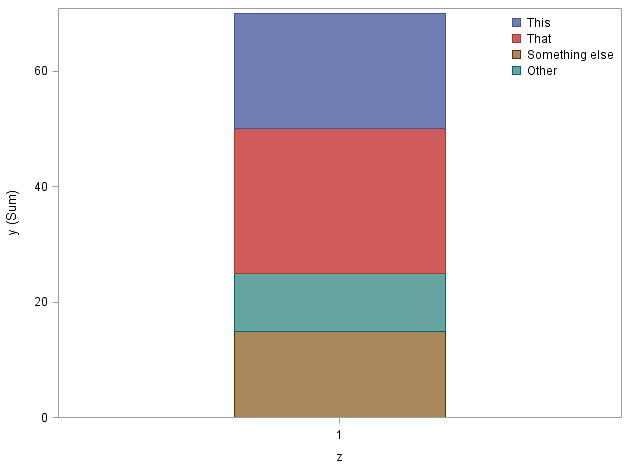
proc sgplot data=temp;
vbar z/group=x groupdisplay=stack response=y name="vbar" barwidth=0.5 grouporder=descending;
keylegend "vbar"/position=topright noborder location=inside down=4
sortorder=descending;
format x xfmt.
run;
The bar order is based on the underlying number, but the legend order is based on the formatted values.
To do something which was simple in SAS/Graph (ie get the formatted legend entries in the correct (visual) order based on the underlying unformatted value), is using GTL and typing in each legend entry the only option? If so is it likely that use of unformatted order for legend entries in SGPLOT could be implemented in future releases?
Accepted Solutions
- Mark as New
- Bookmark
- Subscribe
- Mute
- RSS Feed
- Permalink
- Report Inappropriate Content
Thanks for the prompt reply Sanjay. Nocycleattrs - hadn't thought of that. Works nicely. Thanks.

- Mark as New
- Bookmark
- Subscribe
- Mute
- RSS Feed
- Permalink
- Report Inappropriate Content
Yes, this is a use case that got away. Clearly, it makes sense to be able to plot the legend in the same order as the groups as illustrated by this use case. We will add this to our list of items for the next release. Since V9.4M3 is very close to release, it will have to wait till next year. Feel free to call it in to Tech Support.
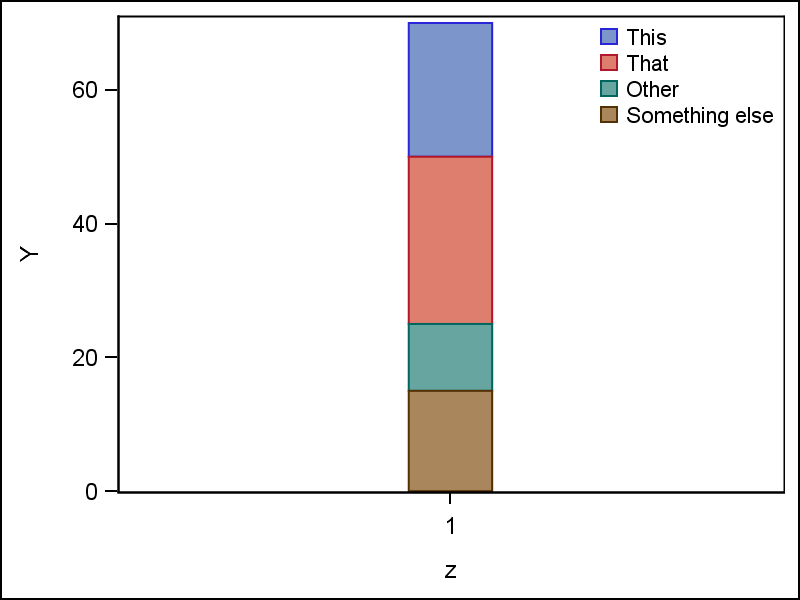
While there is no easy fix, I can suggest a workaround, with a bit of coding. I cannot change the order in the legend, but I can change the order of drawing the bar segments. To do this, I can use a HIGHLOW plot instead of the VBAR. In your simple case, I just compute the full height of the bar stack, and then compute low and high values for each bar segment, starting from the top. Now, the stacking order is top to bottom, same as the legend. You can also do this with multiple categories using PROC MEANS to summarize the data as you want, and then use a Data Step with "BY" processing to reverse each bar segment.
proc format;
value xfmt
1='This'
2='That'
3='Other'
4='Something else';
run;
data temp;
format x xfmt.;
z=1; sum=0;
x=1; y=20; sum=sum+y; output;
x=2; y=25; sum=sum+y; output;
x=3; y=10; sum=sum+y; output;
x=4; y=15; sum=sum+y; output;
call symput ("Sum", sum);
run;
data invert;
retain high ∑
set temp;
low=high-y; output;
high=low;
run;
proc sgplot data=invert;
highlow x=z low=low high=high / type=bar group=x barwidth=0.5 name='a';
keylegend 'a' / position=topright noborder location=inside down=4;
yaxis offsetmin=0 label='Y';
run;
- Mark as New
- Bookmark
- Subscribe
- Mute
- RSS Feed
- Permalink
- Report Inappropriate Content
Thanks for that workaround Sanjay.
I've just used it, and by working out the high/low bar midpoints and adding a scatterplot with datalabels I was even able to get the segment values on.
We have just upgraded to SAS 9.4M03. Hopefully the workaround will be unnecessary in M04.
- Mark as New
- Bookmark
- Subscribe
- Mute
- RSS Feed
- Permalink
- Report Inappropriate Content
Hi Sanjay (and anyone else who might be interested). Turns out there is an easier workaround to getting the 'down' legend order to match the order of stacks for a formatted numeric variable. You need to have a dummy variable which is always = 0. And then you do a second chart with this dummy variable as the reponse variable. And in the second chart statement, grouporder = the opposite of the real chart. (ie ascending or descending). Then base the keylegend on the 'fake' chart and voila! Will be nice though when no workaround is needed 🙂
- Mark as New
- Bookmark
- Subscribe
- Mute
- RSS Feed
- Permalink
- Report Inappropriate Content
Very interesting workaround. What you are doing is "hiding" the reverse plot that is shown in the legend. .So, you really don't need another variable of value zero. You can use the same one, with the reverse order first (and display it in the legend) and overdraw it with the actual one. Need the NOCYCLEATTRS option. Very cool.
proc sgplot data=temp nocycleattrs;
vbar z/group=x groupdisplay=stack response=y barwidth=0.5 grouporder=ascending name="vbar";
vbar z/group=x groupdisplay=stack response=y barwidth=0.5 grouporder=descending;
keylegend "vbar"/position=topright noborder location=inside down=4;
format x xfmt.;
run;
- Mark as New
- Bookmark
- Subscribe
- Mute
- RSS Feed
- Permalink
- Report Inappropriate Content
Thanks for the prompt reply Sanjay. Nocycleattrs - hadn't thought of that. Works nicely. Thanks.
.jpg")
Catch up on SAS Innovate 2026
Nearly 200 sessions are now available on demand with the SAS Innovate Digital Pass.
Explore Now →Learn how use the CAT functions in SAS to join values from multiple variables into a single value.

Find more tutorials on the SAS Users YouTube channel.
SAS Training: Just a Click Away
Ready to level-up your skills? Choose your own adventure.
-
5 replies
-
06-30-2015 11:56 PM
-
26675 views
-
0 likes
-
2 in conversation
-
