- Home
- /
- Programming
- /
- Graphics
- /
- Map Chart in SAS EG 7.1
- RSS Feed
- Mark Topic as New
- Mark Topic as Read
- Float this Topic for Current User
- Bookmark
- Subscribe
- Mute
- Printer Friendly Page

- Mark as New
- Bookmark
- Subscribe
- Mute
- RSS Feed
- Permalink
- Report Inappropriate Content
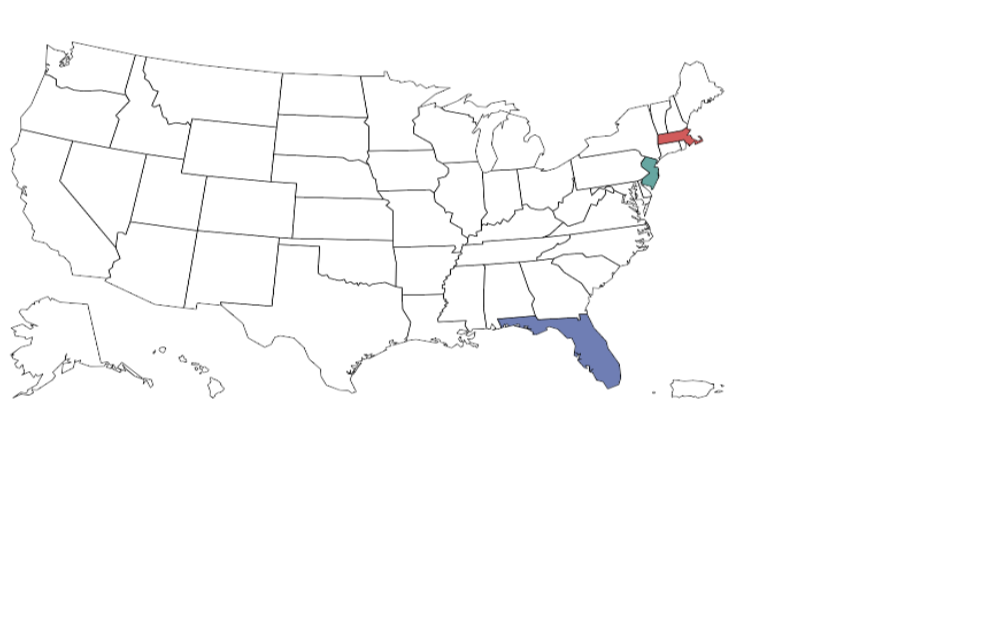
I'm unable to display the data labels in map chart. I need someone to help completing the map chart with the data labels.
From the below chart I wish to display the state names and its figures in highlighted areas. (e.g. NY 100000) . It means highlighted area should determine NY state with its population 100000. I'm grateful if you can provide the solution from point and click interface like -Datasets-> Graph-> Map chart-> select the variables\,datasets and options->run
- Mark as New
- Bookmark
- Subscribe
- Mute
- RSS Feed
- Permalink
- Report Inappropriate Content
Any helpful answers?
- Mark as New
- Bookmark
- Subscribe
- Mute
- RSS Feed
- Permalink
- Report Inappropriate Content
Any helpful answers?
- Mark as New
- Bookmark
- Subscribe
- Mute
- RSS Feed
- Permalink
- Report Inappropriate Content
Still looking for answers.

- Mark as New
- Bookmark
- Subscribe
- Mute
- RSS Feed
- Permalink
- Report Inappropriate Content
You will be able to start this project with the Map Chart task, Chloropleth option -- using the map data set for the US and a response variable for your data to indicate the coloring. This paper by Stephanie Thompson can get you started.
However, to annotate the map area with state names and their populations will require additional data preparation and coding. I'm going to move this discussion to the community where more experts will see it.
Chris
- Mark as New
- Bookmark
- Subscribe
- Mute
- RSS Feed
- Permalink
- Report Inappropriate Content
Any helpful answers?

- Mark as New
- Bookmark
- Subscribe
- Mute
- RSS Feed
- Permalink
- Report Inappropriate Content
I don't think EG provides any easy way to do this.
You will need to write some custom code outside of EG (and then you could use EG to run that code, or run it independently of EG ... whichever is more convenient). It's a bit tricky, and you'll probably need an intermediate level of knowledge in SAS/Graph and "data step" to accomplish it.
There are several Tech Support gmap examples that show various ways to annotate labels on maps...
SAS Innovate 2025: Call for Content
Are you ready for the spotlight? We're accepting content ideas for SAS Innovate 2025 to be held May 6-9 in Orlando, FL. The call is open until September 25. Read more here about why you should contribute and what is in it for you!
Learn how use the CAT functions in SAS to join values from multiple variables into a single value.

Find more tutorials on the SAS Users YouTube channel.
 Click image to register for webinar
Classroom Training Available!
Select SAS Training centers are offering in-person courses. View upcoming courses for:
-
6 replies
-
03-13-2015 09:45 AM
-
2408 views
-
3 likes
-
3 in conversation
-
