- Home
- /
- Programming
- /
- Graphics
- /
- Is there any way we can combine Clustered Sub Group - Bar Graph and Da...
- RSS Feed
- Mark Topic as New
- Mark Topic as Read
- Float this Topic for Current User
- Bookmark
- Subscribe
- Mute
- Printer Friendly Page

- Mark as New
- Bookmark
- Subscribe
- Mute
- RSS Feed
- Permalink
- Report Inappropriate Content
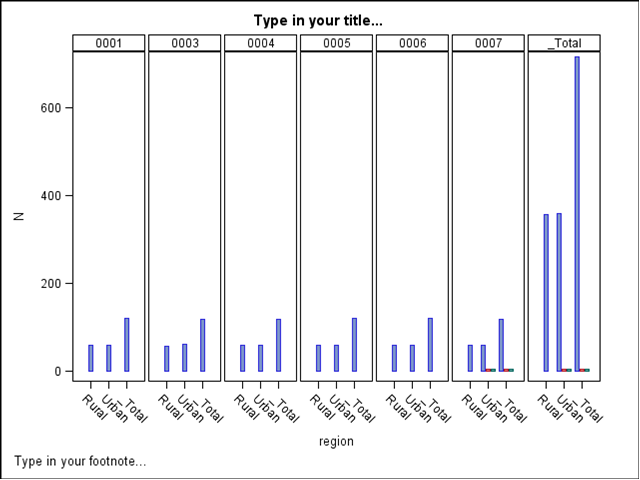
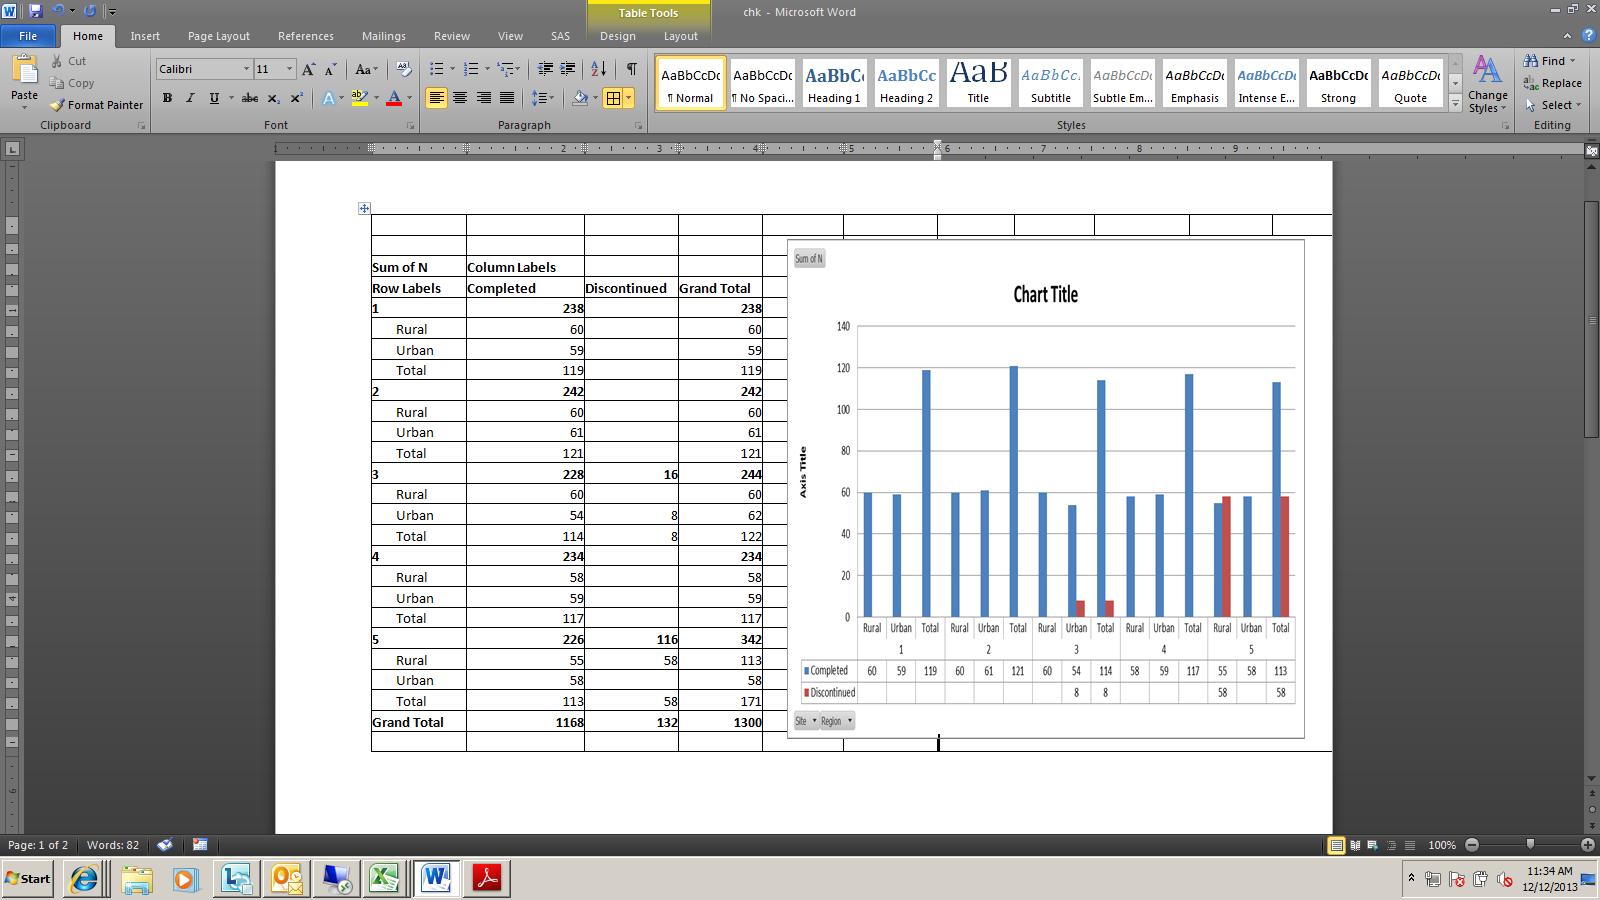
What i need is in similar way in excel, we can club bar chart with datatable. The same structure we can do with proc template --> and layouts but sub group will not able to create. Can any one suggest me on this?

- Mark as New
- Bookmark
- Subscribe
- Mute
- RSS Feed
- Permalink
- Report Inappropriate Content
You can use the idea shown in this article. Just replace the scatter / series plot with a bar chart. If you have SAS 9.3, you can use GROUPDISPLAY=CLUSTER.
- Mark as New
- Bookmark
- Subscribe
- Mute
- RSS Feed
- Permalink
- Report Inappropriate Content
Hi Sanjay, Thanks for your replay. However, there is a limitation has been found that, subgroup option cannot be used when we have datatable in PROC TEMPLATE.
- Mark as New
- Bookmark
- Subscribe
- Mute
- RSS Feed
- Permalink
- Report Inappropriate Content
Please attach your program with data so it is easier to see what you are doing.
- Mark as New
- Bookmark
- Subscribe
- Mute
- RSS Feed
- Permalink
- Report Inappropriate Content
SAS Innovate 2025: Call for Content
Are you ready for the spotlight? We're accepting content ideas for SAS Innovate 2025 to be held May 6-9 in Orlando, FL. The call is open until September 25. Read more here about why you should contribute and what is in it for you!
Learn how use the CAT functions in SAS to join values from multiple variables into a single value.

Find more tutorials on the SAS Users YouTube channel.
 Click image to register for webinar
Classroom Training Available!
Select SAS Training centers are offering in-person courses. View upcoming courses for:
-
4 replies
-
12-11-2013 07:47 AM
-
1272 views
-
0 likes
-
2 in conversation
-
