- Home
- /
- Programming
- /
- Graphics
- /
- Alternating boxplot colors
- RSS Feed
- Mark Topic as New
- Mark Topic as Read
- Float this Topic for Current User
- Bookmark
- Subscribe
- Mute
- Printer Friendly Page

- Mark as New
- Bookmark
- Subscribe
- Mute
- RSS Feed
- Permalink
- Report Inappropriate Content
Hello, I am programming boxplots using proc boxplot with a grouping variable (trt)
The code goes like this:
proc boxplot data = test3 ;
symbol value=dot height=1 c=blue;
plot var1* time (trt) / cframe = vligb
cboxes = dagr
cboxfill =ywh ;
My question is whether there is a way to fill the boxes with aternative colors - since I am comparing 2 treatment groups? The x-axis is arranged such that for for time=1 I have 2 boxes above - one for trt A and one for trt B. After that there is time=2 with 2 boxes above - A and B. I want to differentiate between A and B.
Thanks in advance.

- Mark as New
- Bookmark
- Subscribe
- Mute
- RSS Feed
- Permalink
- Report Inappropriate Content
If none of the built-in boxplots (proc boxplot, gtl, or gplot with interpol=box) support this, you might have to use some custom programming to create it.
Here's an example I wrote, that draws basic boxplot geometry with annotate - it would require quite a bit of further customizing to get the exact boxplot you're wanting. You could programmatically control the color of each box (based on values in the data), etc. I guess the 'tough' part would be visually/spatially "grouping" the bars together, since the annotate coordinates are based on gplot, and gplot doesn't have support for official groups.
http://robslink.com/SAS/book/example10.htm
Here's the code:
http://robslink.com/SAS/book/example10_info.htm
I describe how the code works, in detail, in my book "SAS/Graph: Beyond the Basics" - it's Example 10, on pp. 65-70.
- Mark as New
- Bookmark
- Subscribe
- Mute
- RSS Feed
- Permalink
- Report Inappropriate Content
Thanks Rob.
Your code looks quite complicated. It will take me some time. I was hoping for a more "built in" solution. Is there a way to use annotate (with which I'm really not very familiar ) to color every other box? And can I use annotate with proc boxplot?

- Mark as New
- Bookmark
- Subscribe
- Mute
- RSS Feed
- Permalink
- Report Inappropriate Content
The answer depends on which release you are using.
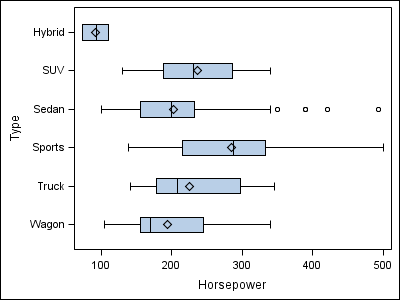
At SAS 9.2 - A simple (non-grouped) Horizontal box plot can be made as below:
proc sgplot data=sashelp.cars;
hbox horsepower / category=type;
run;
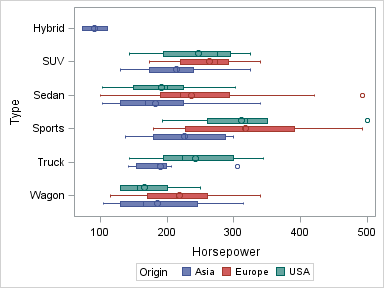
At SAS 9.3 - A grouped Horizontal box plot can be made as below:
proc sgplot data=sashelp.cars;
hbox horsepower / category=type group=origin groupdisplay=cluster;
run;
But, you may not have SAS 9.3, in which case you can use SAS 9.2 GTL by overlaying two box plots, and use DiscreteOffsets to position them side by side. See this article on Distribution of Max LFT.

- Mark as New
- Bookmark
- Subscribe
- Mute
- RSS Feed
- Permalink
- Report Inappropriate Content
hi ... here's a 'non-SG solution' ...
I made up some data similar to yours (sort of, maybe you can tweak your data a little to match what I used)
I used the CBOXFILL=(variable) option to change colors according to treatment ...
data x;
array color(2) $4 _temporary_ ('red' 'blue');
do time=1 to 5;
do trt=1 to 2;
* vary color by treatment;
c=color(trt);
n+1;
* 100 observations at each time/treatment combo;
do k=1 to 100;
var1 = ceil(trt*500*ranuni(0));
output;
end;
end;
end;
drop k;
run;
proc sort data=x;
by n;
run;
proc format;
value trt
1='TRT:A' 2='TRT:B';
value tm
1='TIME 1' 2='TIME 2' 3='TIME 3' 4='TIME 4' 5='TIME 5';
run;
goptions reset=all gunit=pct ftext='calibri' htext=2;
axis1 value=none label=none major=none ;
axis2 label=('VARIABLE 1');
* white space around plot;
title1 ls=2;
title2 a=90 ls=2;
title3 a=-90 ls=2;
footnote1 ls=2;
proc boxplot data=x;
plot var1*n(trt time) / cboxfill=(c) haxis=axis1 vaxis=axis2;
format trt trt. time tm.;
run;
quit;

- Mark as New
- Bookmark
- Subscribe
- Mute
- RSS Feed
- Permalink
- Report Inappropriate Content
Thank you everyone for your help.
I got the box plots to alternate colors by assigning the colors based on the treatment and then using the cboxfill=(color variable name) as described above.
.jpg")
Catch up on SAS Innovate 2026
Nearly 200 sessions are now available on demand in the Innovate Hub.
Watch Now →Learn how use the CAT functions in SAS to join values from multiple variables into a single value.

Find more tutorials on the SAS Users YouTube channel.
SAS Training: Just a Click Away
Ready to level-up your skills? Choose your own adventure.
-
5 replies
-
05-29-2012 02:28 PM
-
12879 views
-
1 like
-
4 in conversation
-
