- Home
- /
- Analytics
- /
- Forecasting
- /
- Re: Cross sectional time series regression
- RSS Feed
- Mark Topic as New
- Mark Topic as Read
- Float this Topic for Current User
- Bookmark
- Subscribe
- Mute
- Printer Friendly Page

- Mark as New
- Bookmark
- Subscribe
- Mute
- RSS Feed
- Permalink
- Report Inappropriate Content
Hello all,
I need a help with a model.
For each quarter I need to run a cross-sectional (across K securities) regression of the fraction of investors buying security κ (Δκ,τ) in the current quarter on the fraction of investors buying security κ the previous quarter (Δκ,τ-1).
So, we have this autoregressive model of order 1: Δκ,τ = βΔκ,τ-1 + εt
The initial file is attached (Have).
By doing this:
proc reg data=have outest=need edf plots=none;
by qtr;
model Fraction = prevFraction / noint;
run;
I get the attached file (need)
However, I wanted to check if the results are correct. So, I did the process step-by-step. I only used the first 2 quarters 1980-N4 and 1981-N1 to see if I will get the same results (the dependent variable is the 1981_N1 and the independent is the 1980-N4); I attach the file (Test). And the results actually are different.
I have tried proc tscreg as well, but cannot get it right.
Any suggestions?
Accepted Solutions

- Mark as New
- Bookmark
- Subscribe
- Mute
- RSS Feed
- Permalink
- Report Inappropriate Content
Hello -
Some thoughts which you might find beneficial.
The first thing I would do is to fill in the gaps of your data (you are facing missing values both in the time dimension and your measurements). One way to go about this is to use PROC TIMESERIES of SAS/ETS:
proc sort data=have2;by ticker qtr;run;
proc timeseries data=have2 out=have3 outsum=outsum;
id qtr interval=qtr start="01OCT80"d end="01APR1982"d;
var fraction;
by ticker;
run;
Note that I extended all series to start and end at the same time point.
OUTSUM will provide you with some statistics about your data - in particular you will find which series contain too many missing values or other problems. I would suggest to have a look at the _status_ variable first - if is is not 0, there is a problem with a particular series - see http://support.sas.com/documentation/cdl/en/etsug/65545/HTML/default/viewer.htm#etsug_timeseries_det... for details on the _status_ values.
You are facing about 2000 series - typically in time series forecasting assuming the same model formulation for each time series in advance (such as AR(1)) is not a good practice. Actually you may want to use a time series model formulation which account for your data pattern at hand. As you may know SAS offers software to accomplish such task in an almost automated manner - I'd suggest to check out http://www.sas.com/technologies/analytics/forecasting/index.html.
Alternatively you could consider using the existing Time Series Forecast System in SAS/ETS (see http://support.sas.com/documentation/cdl/en/etsug/63939/HTML/default/viewer.htm#tfintro_toc.htm) but note that it does not support any BY variables - you will need to create a new data mart which features one variable per series in your original data set.
Finally: for creating lagged variables you may want to have a look at the LAG function - see: http://support.sas.com/documentation/cdl//en/lefunctionsref/63354/HTML/default/viewer.htm#n0l66p5oqe...
Hope this is useful.
Thanks,
Udo
- Mark as New
- Bookmark
- Subscribe
- Mute
- RSS Feed
- Permalink
- Report Inappropriate Content
Hello -
If you have access to SAS/ETS software, you should go ahead and have a look at either:
- The ARIMA procedure provides the identification, parameter estimation, and forecasting of autoregressive integrated moving-average (Box-Jenkins) models, seasonal ARIMA models, transfer function models, and intervention models
- The AUTOREG procedure provides regression analysis and forecasting of linear models with autocorrelated or heteroscedastic errors
I looked at your data, but I got confused about your usage of "prevFraction". Initially I thought that prevFraction is the lagged value of Fraction, but it is not.
For example for ticker AAPL:
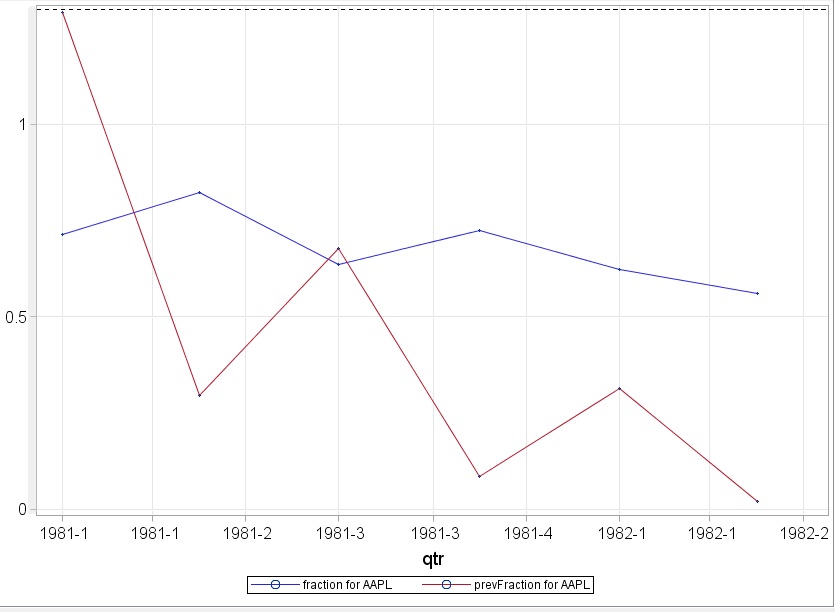
For other tickers there are data quality problems like different length of history, missing information, etc (see ABLE or ADC for example).
If prevFraction does not feature lagged values of Fraction, then your equation above does not work - you will have to come up with an ARIMAX formulation for example, which features prevFraction as an input variable. If prevFraction is indeed a lag1 value of Fraction, then you don't need to specify a column - you can use standard ARIMA syntax.
Thanks,
Udo
- Mark as New
- Bookmark
- Subscribe
- Mute
- RSS Feed
- Permalink
- Report Inappropriate Content
Many thanks for your reply Udo.
You are right. The prevFraction is the lagged fraction (of each stock). However, how I can create a variable for that? obviously the method i used didn't work right.
Regarding the data. It could be the case that some stocks are not traded in some quarters, or are traded later. So, it will be the case that some quarters will have less observations that others (in case that it is traded this quarter but not the previous then this stock should be omitted from the regression).
I don't have any experience in ARIMA but I had a look on it and I don't get how it can give me the results I want for each quarter.
So, in a few worlds, what I want to do is for each quarter to regress the fraction of the stocks on their previous quarter's fractions (for those stocks that have observations in both quarters, otherwise they should be omitted).
Many thanks for your time.
I tried this one but it doesnt' work:
proc arima data=have2;
by qrt;
identify var= fraction;estimate p=1 noint;run;

- Mark as New
- Bookmark
- Subscribe
- Mute
- RSS Feed
- Permalink
- Report Inappropriate Content
Hi,
If you have cross-sectional data measured across time I would suggest having a look at PROC PANEL instead: http://support.sas.com/documentation/cdl/en/etsug/63939/HTML/default/etsug_panel_sect001.htm
Thanks,
Snurre
- Mark as New
- Bookmark
- Subscribe
- Mute
- RSS Feed
- Permalink
- Report Inappropriate Content
Hello -
Some thoughts which you might find beneficial.
The first thing I would do is to fill in the gaps of your data (you are facing missing values both in the time dimension and your measurements). One way to go about this is to use PROC TIMESERIES of SAS/ETS:
proc sort data=have2;by ticker qtr;run;
proc timeseries data=have2 out=have3 outsum=outsum;
id qtr interval=qtr start="01OCT80"d end="01APR1982"d;
var fraction;
by ticker;
run;
Note that I extended all series to start and end at the same time point.
OUTSUM will provide you with some statistics about your data - in particular you will find which series contain too many missing values or other problems. I would suggest to have a look at the _status_ variable first - if is is not 0, there is a problem with a particular series - see http://support.sas.com/documentation/cdl/en/etsug/65545/HTML/default/viewer.htm#etsug_timeseries_det... for details on the _status_ values.
You are facing about 2000 series - typically in time series forecasting assuming the same model formulation for each time series in advance (such as AR(1)) is not a good practice. Actually you may want to use a time series model formulation which account for your data pattern at hand. As you may know SAS offers software to accomplish such task in an almost automated manner - I'd suggest to check out http://www.sas.com/technologies/analytics/forecasting/index.html.
Alternatively you could consider using the existing Time Series Forecast System in SAS/ETS (see http://support.sas.com/documentation/cdl/en/etsug/63939/HTML/default/viewer.htm#tfintro_toc.htm) but note that it does not support any BY variables - you will need to create a new data mart which features one variable per series in your original data set.
Finally: for creating lagged variables you may want to have a look at the LAG function - see: http://support.sas.com/documentation/cdl//en/lefunctionsref/63354/HTML/default/viewer.htm#n0l66p5oqe...
Hope this is useful.
Thanks,
Udo
- Mark as New
- Bookmark
- Subscribe
- Mute
- RSS Feed
- Permalink
- Report Inappropriate Content
Many thanks Udo!
I will check it.
- Mark as New
- Bookmark
- Subscribe
- Mute
- RSS Feed
- Permalink
- Report Inappropriate Content
PS: just in case you are wondering about how to transpose your data set for the Time Series Forecasting System to work - check out:
proc sort data=tsslib.have3;
by descending qtr;
run;
proc transpose data=tsslib.have3 out=have4(drop=source) name=source;
by descending qtr;
id ticker;
var fraction;
quit;
proc sort data=have4;
by qtr;
run;
Remember that the Time Series Forecasting System was not designed for these kinds of tasks - you are much better of with SAS Forecast Server or SAS Forecasting for Desktop (http://support.sas.com/software/products/forecast_desktop/index.html).
.jpg")
Catch up on SAS Innovate 2026
Nearly 200 sessions are now available on demand with the SAS Innovate Digital Pass.
Explore Now →- Spring 2026 ESUG Meeting - Social Celebration | 02-Jun-2026
- Spring 2026 ESUG Meeting | 03-Jun-2026
- Ask the Expert: Fast, Clear, Beautiful: Your First Steps With PROC SGPLOT | 04-Jun-2026
- Ask the Expert: R and SAS Working Seamlessly Together: Unlocking PROC R in Viya for Life Sciences | 11-Jun-2026
- Ask the Expert: Can Agents Reduce Planning Friction in CPG Supply Chains? | 16-Jun-2026
- Ask the Expert: Get Meaningful Results With New Features in SAS Customer Intelligence 360 | 25-Jun-2026
-
6 replies
-
05-12-2013 11:41 AM
-
7614 views
-
6 likes
-
3 in conversation
-
