- Home
- /
- Programming
- /
- Enterprise Guide
- /
- Re: Summary Tables with a Column % with values like '5E3%' ?
- RSS Feed
- Mark Topic as New
- Mark Topic as Read
- Float this Topic for Current User
- Bookmark
- Subscribe
- Mute
- Printer Friendly Page

- Mark as New
- Bookmark
- Subscribe
- Mute
- RSS Feed
- Permalink
- Report Inappropriate Content
Hi Forum,
I am creating a Summary table from Numeric data in SAS EG 5.1 64 bit.
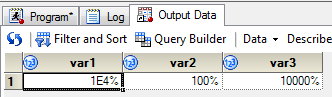
All goes well until I add the Format for a Percentage of each Column as I get strange results like the above.
100% seems to appear as 1E4%.
I've tried all the % type Formats but no luck getting a normal number?
Can anyone advise what's going on?
Thanks.
Accepted Solutions

- Mark as New
- Bookmark
- Subscribe
- Mute
- RSS Feed
- Permalink
- Report Inappropriate Content
As shown in the screenshot I've posted the default length of the percent format 'percent.' is too short to show 10000%. That's why SAS uses scientific notation. When using the format with a increased length 'percent8.' then you get 10000% (100*100).

- Mark as New
- Bookmark
- Subscribe
- Mute
- RSS Feed
- Permalink
- Report Inappropriate Content
Are your numbers between 0 and 1?
- Mark as New
- Bookmark
- Subscribe
- Mute
- RSS Feed
- Permalink
- Report Inappropriate Content
Hi Reeza,
No, the values are 8 digit Numeric Codes like '23432344' & I'm counting them by 2 Areas.
So I have a summary of Area 1 which is a count of those Codes & the same for Area 2.
- Mark as New
- Bookmark
- Subscribe
- Mute
- RSS Feed
- Permalink
- Report Inappropriate Content
Could it be that the internal value for 100% is actually 100 instead of 1?
data test;
format var1 var2 percent. var3 percent8.;
var1=100;
var2=1;
var3=100;
run;
- Mark as New
- Bookmark
- Subscribe
- Mute
- RSS Feed
- Permalink
- Report Inappropriate Content
That could well be the case Patrick, do you know how I can get it to display numbers though?
- Mark as New
- Bookmark
- Subscribe
- Mute
- RSS Feed
- Permalink
- Report Inappropriate Content
You use a different format, eg. best32.
- Mark as New
- Bookmark
- Subscribe
- Mute
- RSS Feed
- Permalink
- Report Inappropriate Content
That change to BEST32 gives a Number but I want it to show the % in the Table Cell next to the Number.
The Column Description has % in it, so I'm wondering if getting the Table Cell to also show 46% for example is possible?
- Mark as New
- Bookmark
- Subscribe
- Mute
- RSS Feed
- Permalink
- Report Inappropriate Content
If you want to see percent then you should use the correct internal values. 50% is the same like 0.5 - it's not a value of 50 with a percent sign.
I suggest that you amend your calculations accordingly.
It would be possible to add a '%' sign to any value using a picture format - but I would call this "deceptive".
proc format;
picture cheat
other='0000000%'
;
run;
data test;
format var1 cheat.;
var1=50;
run;
- Mark as New
- Bookmark
- Subscribe
- Mute
- RSS Feed
- Permalink
- Report Inappropriate Content
I would have thought SAS would be able to add a number of values in categories & derive a % of each category regardless of the format.
The values it is counting could be 0.5 but this would still be a % of 50 '0.5s' out of a population of 200 values & therefore give me 25%.
- Mark as New
- Bookmark
- Subscribe
- Mute
- RSS Feed
- Permalink
- Report Inappropriate Content
Oscarboots wrote:

I would have thought SAS would be able to add a number of values in categories & derive a % of each category regardless of the format.

The values it is counting could be 0.5 but this would still be a % of 50 '0.5s' out of a population of 200 values & therefore give me 25%.
It can, you're just not doing it right ![]()
Perhaps start your question from scratch and we can help you get where you want to go.
For example, the summary you're looking for sounds like something you'd do via Task>Describe>One way Frequencies or Table Analysis
Then look into all the options to make sure you add the percents the way you'd like.
- Mark as New
- Bookmark
- Subscribe
- Mute
- RSS Feed
- Permalink
- Report Inappropriate Content
 Correct Reeza!
Here are my steps;
- Select the data Node I need, go to Tasks >> Describe >> Summary tables Wizard
- To the 'Analysis variables', I add the 'OrderActualID' field with the statistic '% of Column Frequency'
- Next, I add 'RoundID' to the 'Columns' area
- 'Spend_Category' to the 'Rows' area
- 'Week_Ending' to the 'Pages' area
- That's it to give me the actual %s of the % of Column for 'OrderActualID' but it doesn't display a '%' sign next to the number
- It's when I add the Format of 'PERCENT6.1' in Step 2 of the process under 'Select table Format' is when I get the scientific format??
Any suggestions
- Mark as New
- Bookmark
- Subscribe
- Mute
- RSS Feed
- Permalink
- Report Inappropriate Content
I stand corrected, it can't :smileyangry:
You'll have to create a custom format and apply as indicated by Cynthia
However, I still think you have a mistake in your process. The analysis is typically something you'll add, average, take the median and orderID doesn't sound like some thing like that.

- Mark as New
- Bookmark
- Subscribe
- Mute
- RSS Feed
- Permalink
- Report Inappropriate Content
Hi:
The SAS Percent format does an automatic multiply by 100 -- for the purpose of turning your decimal number (like .05 and .23 into the percents 5% and 23%). So if you have integer numbers in the cell that have already been multiplied by 100, then the Percent format is going to do another multiply by 100, which will not be what you want.
For example, when you are using PROC TABULATE, which also does a multiply by 100 for it's internally calculated percents, you CANNOT use the SAS Percent format because then you will multiply by 100 two times. This is where, with TABULATE, you MUST use a PICTURE format such as shown below to get the % into the cell.
cynthia
proc format;
picture mypct low-high='009.99%';
run;
- Mark as New
- Bookmark
- Subscribe
- Mute
- RSS Feed
- Permalink
- Report Inappropriate Content
Thanks Cynthia,
So is that why I'm getting a scientific number?
If that's what it is?
- Mark as New
- Bookmark
- Subscribe
- Mute
- RSS Feed
- Permalink
- Report Inappropriate Content
As shown in the screenshot I've posted the default length of the percent format 'percent.' is too short to show 10000%. That's why SAS uses scientific notation. When using the format with a increased length 'percent8.' then you get 10000% (100*100).
.jpg")
Catch up on SAS Innovate 2026
Nearly 200 sessions are now available on demand with the SAS Innovate Digital Pass.
Explore Now →Check out this tutorial series to learn how to build your own steps in SAS Studio.

Find more tutorials on the SAS Users YouTube channel.
SAS Training: Just a Click Away
Ready to level-up your skills? Choose your own adventure.
-
16 replies
-
10-07-2014 07:57 PM
-
7716 views
-
6 likes
-
4 in conversation
-
