- Home
- /
- Programming
- /
- Enterprise Guide
- /
- Re: Create SAS table of proportional values which can then be looked u...
- RSS Feed
- Mark Topic as New
- Mark Topic as Read
- Float this Topic for Current User
- Bookmark
- Subscribe
- Mute
- Printer Friendly Page

- Mark as New
- Bookmark
- Subscribe
- Mute
- RSS Feed
- Permalink
- Report Inappropriate Content
Hi,
I need to create a table which shows the proportional split by variable in a number of weeks. Easy enough via summary table / proc tabulate. Example below.
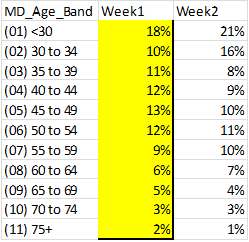
I then need to be able to lookup the intersection value of week 1 and 45 to 49 and return it into my table data so that every transaction line has the appropriate percentage.
I'll then use this to reweight my batch of data.
The time periods I have go over a couple of years.
In excel terms this feels like a lookup with an IF nested, though it's a massive nest.
I have a workaround which involves exports, calculating in excel and imports but I'd keep it clean in SAS EG.
Any help is appreciated.
Thanks,
JJ

- Mark as New
- Bookmark
- Subscribe
- Mute
- RSS Feed
- Permalink
- Report Inappropriate Content
Does the "week" imply a year? As in when you compare date such as Jan 1 2012 and Jan 1 2014 are they both in week 1?
What rule are you using for assigning date to week? SAS natively supports 3 different rules, look in the documentation for the function WEEK and descriptors U, V and W.
Are your dates SAS date values?
Are your ages numeric with the value displayed the result of a format or are they those character strings (goes to writing comparison logic)?
This may be easier if your lookup data is in the long form of
Age(range) WeekNumber Value
- Mark as New
- Bookmark
- Subscribe
- Mute
- RSS Feed
- Permalink
- Report Inappropriate Content
It's from a SAS data set so yes the dates are in SAS format.
I've put a week format over the top of that to create my week column.
Therefore in your example yes those week 1's are comparable.
The ages are character strings generated from a format applied with a put.
I absolutely agree it would be easier to have it as a long form, however I do not know in SAS how to so it so that all of week1 adds to 100% then all of week2 adds to 100%. Any advice there is appreciated? Perhaps a version of group by... might work
- Mark as New
- Bookmark
- Subscribe
- Mute
- RSS Feed
- Permalink
- Report Inappropriate Content
It may help to print 10 or so lines to show the actual structure of the dataset. Your comment about "adding to %100" makes me think that the example data you showed is not what you are starting with. Describe what you start with and the desired result.
- Mark as New
- Bookmark
- Subscribe
- Mute
- RSS Feed
- Permalink
- Report Inappropriate Content
Hi,
This is a sas data set so the data is in SAS format.
I've put formats over the top of it. The picture in the message is just an example rather than the exact format. My dates show in sas as 13W14 for example.
Ages are characters strings.
I would ideally like to have a list that I can lookup into so that long form that you describe would be ideal (there will be many variables included).
However, I don't know how to get sas to generate this % of the first variable.
I've been playing around with proc freq and the outpct but once I get to 4 variables, it stops working. The overall percent figure generated is inaccurate.
My variables are A, B C, D, E,
I need to know what percentage each element of E is of element A.
A in this instance is the week number
.jpg")
Catch up on SAS Innovate 2026
Nearly 200 sessions are now available on demand in the Innovate Hub.
Watch Now →Check out this tutorial series to learn how to build your own steps in SAS Studio.

Find more tutorials on the SAS Users YouTube channel.
SAS Training: Just a Click Away
Ready to level-up your skills? Choose your own adventure.
-
4 replies
-
08-24-2015 08:40 AM
-
2447 views
-
0 likes
-
2 in conversation
-
