- Home
- /
- Programming
- /
- Enterprise Guide
- /
- Re: Counting number of non-numeric values within multiple columns on t...
- RSS Feed
- Mark Topic as New
- Mark Topic as Read
- Float this Topic for Current User
- Bookmark
- Subscribe
- Mute
- Printer Friendly Page

- Mark as New
- Bookmark
- Subscribe
- Mute
- RSS Feed
- Permalink
- Report Inappropriate Content
Hello ![]() . I'm new to SAS EG. I have an issue that intuitively feels that it should be really easy to resolve in SAS EG, but for the life of me I can't find the solution/function to make it work. I'm sure I'll be embarrassed by the answer.
. I'm new to SAS EG. I have an issue that intuitively feels that it should be really easy to resolve in SAS EG, but for the life of me I can't find the solution/function to make it work. I'm sure I'll be embarrassed by the answer.
How can I calculate the columns "Count of A", "Count of B" and "Count of null"? The N function only seems to work with number formats and the Count function only seems to work within one column - but I'm happy to be corrected.
Incidentally in real life there could be upwards of 30 columns to check.
| CustomerID | Product | 2011_01 | 2011_02 | 2011_03 | 2011_04 | 2011_05 | 2011_06 | Count of A | Count of B | Count of null |
| 111 | Widgets | A | A | B | 2 | 1 | 3 | |||
| 111 | Gadgets | A | A | A | B | 3 | 1 | 2 | ||
| 222 | Gadgets | A | A | 2 | 0 | 4 | ||||
| 333 | Widgets | A | A | A | 3 | 0 | 3 | |||
| 333 | Gadgets | A | A | A | B | B | 3 | 2 | 1 | |
| 333 | Gizmos | A | A | A | 3 | 0 | 3 |
Thanks in advance for any tips.

- Mark as New
- Bookmark
- Subscribe
- Mute
- RSS Feed
- Permalink
- Report Inappropriate Content
Hi,
Does the following help?:
data _null_;
length var1-var6 $ 1;
var1='';
var2='A';
var3='A';
var4='';
var5='B';
var6='';
count_of_a =count(cat(of var1-var6),'A');
count_of_b =count(cat(of var1-var6),'B');
count_of_null=count(cat(of var1-var6),'');
put count_of_a=;
put count_of_b=;
put count_of_null=;
run;
Regards,
Amir.
- Mark as New
- Bookmark
- Subscribe
- Mute
- RSS Feed
- Permalink
- Report Inappropriate Content
Hi Amir,
I don't know! I was hoping I could do this simply in a computed column, for example. I don't have any experience of inputting code in SAS EG.

- Mark as New
- Bookmark
- Subscribe
- Mute
- RSS Feed
- Permalink
- Report Inappropriate Content
Hi, John
The easiest way to do this is a little roundabout; the advantage is that you won't need to worry about how many date columns you have.
Give this a try, and let us know what you think.
Step 1: Transpose the data
- With your dataset open in EG, click on Data | Transpose...
- Move your date columns to the "Transpose variables" role, and move CustomerID and Product to the "Group analysis by" role.
Run the task. You should see a result with just three columns, but the date columns have been converted to rows. Now any of the SAS analysis tools will work. Here's an example:
Step 2: Produce the table
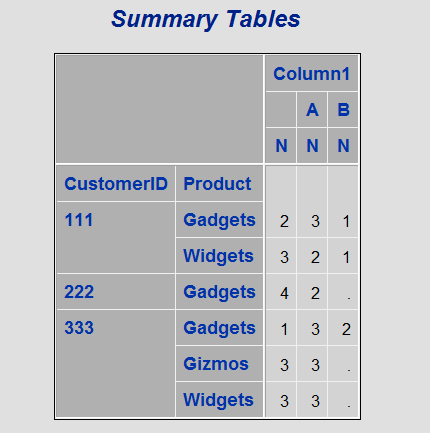
- With your transposed data open, click on Describe | Summary Tables
- Move CustomerID, Product, and the transposed dates (probably "Column1") to the Classification variables role.
- On the "Summary Tables" tab, move CustomerID and Product to the row dimension, and Column1 to the column dimension. Leave N as the statistic.
Run the task. You should see something like this:
.jpg")
Catch up on SAS Innovate 2026
Nearly 200 sessions are now available on demand with the SAS Innovate Digital Pass.
Explore Now →Check out this tutorial series to learn how to build your own steps in SAS Studio.

Find more tutorials on the SAS Users YouTube channel.
SAS Training: Just a Click Away
Ready to level-up your skills? Choose your own adventure.
-
3 replies
-
10-02-2013 06:24 AM
-
4053 views
-
0 likes
-
3 in conversation
-
