- Home
- /
- Solutions
- /
- Data Management
- /
- Re: Merged Excel Header to Proc Freq
- RSS Feed
- Mark Topic as New
- Mark Topic as Read
- Float this Topic for Current User
- Bookmark
- Subscribe
- Mute
- Printer Friendly Page

- Mark as New
- Bookmark
- Subscribe
- Mute
- RSS Feed
- Permalink
- Report Inappropriate Content
Let's say I have a survey question that asks which topics a person has a desire to learn about. The respondent can select all that apply. The responses are then placed into an excel document with a merged header. I want to be able to count how many people selected a certain topic, even when they may have selected more than one. An example data set is: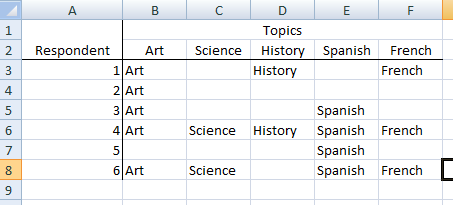
I could merge the variables into one variable called Topic, but then how would I run a frequency for just the number of respondent who answered "Art" as one of the topics? Since it is a survey, if I keep the topics in separate columns as shown, then when I run a freq procedure, it will only count those who responded art (5 persons) and not include the 6th person in the percentages (i.e. it returns 100% (5/5) when in reality it should be 83.3% (5/6) since 1 person did not select Art).
I guess what I want to do, is run a frequency for the variable "Topic" and have SAS return "Art" 5/6; "Science" 2/6; "History" 2/6; "Spanish" 4/6, etc,
I know the solution to this is probably very easy, but I think my brain is fried for the day! Any help would be great!

- Mark as New
- Bookmark
- Subscribe
- Mute
- RSS Feed
- Permalink
- Report Inappropriate Content
This is an example of a multiple response variable. The trick to them is that sometimes you want to use the data in the form you have (for example, to get a count of respondents), but for other analyses you want to use the table in a transposed form:
Respondent Topic Y/N
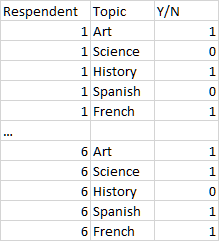
Once you have the table in both forms, you should be able to tabulate against one or the other, keep the results as new data tables, and then combine those data results to get pretty much anything you want.
Tom
- Mark as New
- Bookmark
- Subscribe
- Mute
- RSS Feed
- Permalink
- Report Inappropriate Content
Hi Tom,
Thanks for the tip. The only problem with setting up my table this way is that I would have to manually enter all the data... unless there is some way to do it easily that you know about... For a survey with a large number of respondents, it would be prone to data entry error and just be very timely.
Any tips on how to easily transpose my table? The survey data collection tool I am using doesn't allow any leeway in how the excel document is set-up, so this would have to all be done manually.
- Mark as New
- Bookmark
- Subscribe
- Mute
- RSS Feed
- Permalink
- Report Inappropriate Content
Hi, "loloaloha13"(?)
Yeah, I'm not a big fan of manual data entry. Once you hit 50, you get really lazy.
Assuming you can get your data into a SAS dataset "work.have" in the form
Try these lines of code:
proc sort data=have;
by Respondent;
run;
proc transpose data=have out=want;
var Art Science History Spanish French;
by Respondent;
run;

- Mark as New
- Bookmark
- Subscribe
- Mute
- RSS Feed
- Permalink
- Report Inappropriate Content
a sample code , not tested.
proc sql;
create table want as
select count(Art)/count(*) as Art,
count(Science)/count(*) as Science,
count(History)/count(*) as History
from have;
quit;

- Mark as New
- Bookmark
- Subscribe
- Mute
- RSS Feed
- Permalink
- Report Inappropriate Content
This question looks like it should be simple and my answer may seem a little long, but SAS and Excel do not play well when Excel has Merged cells. However the even that can be overcome. I am using SAS V9.4 (TS1M1) with the "SAS/ACCESS Interface to PC Files" software installed. I am also using Excel 2013. The problem is to get around the merged cells. I like to use the libname statement to read most Excel files. In this case I would also use a SAS option called Firstobs and set the value to two.
Your real problem in this Question is how to I create a SAS dataset that I can submit to PROC FREQ that will have the correct number of rows columns and responses. I have created that dataset for you, but you need to either read on or skip to the bottom of this post to find it.
William E Benjamin Jr
SAS Press - William E. Benjamin, Jr. Author Page
= = = = = = = = = = = = = = = = = = = = = = = = = = = = = = = = = = = = = = = = = = = = =
libname test "c:\temp\respondent_classes.xlsx";
options firstobs=2;
For example if you set firstobs = 1 (the default) then print the Excel file you get the following (The type face here is proportional, So I lined up the columns) :
proc print data=test."Sheet1$"n;
run;
Obs Respondent Topics F3 F4 F5 F6
1 . Art Science History Spanish French
2 1 Art History French
3 2 Art
4 3 Art Spanish
5 4 Art Science History Spanish French
6 5 Spanish
7 6 Art Science Spanish French
Notice OBS #1 it has a missing value for the value of the variable Respondent. This is because the Variable names and the first row of data (OBS 1 and 2) are from the merged header from Excel. Variables F3, F4, F5, and F6 are generated from the blank cells in the first row of the Excel worksheet. The "OBS 1" record above is really the data in the second row of the Excel worksheet (part 2 of the merged header - you would see them as the "Names" of the variables), but when you set the firstobs=2 the printout looks like this.
Obs Respondent Topics F3 F4 F5 F6
2 1 Art History French
3 2 Art
4 3 Art Spanish
5 4 Art Science History Spanish French
6 5 Spanish
7 6 Art Science Spanish French
So, why do this. Well look at the variable names. The first two variable names are from the top of the Excel set of merged cells, The rest are just sequentially numbered. That looks like a pattern to me. If you can find a pattern then you can write a program to reproduce it. Take the following code:
%macro get_class(col,class);
data &class (keep=respondent &class);
set test.'Sheet1$'n (rename=(&col=&class) where=(upcase(&class) = "&class")) ;
run;
%mend get_class;
%get_class(TOPICS ,ART );
%get_class(F3 ,SCIENCE );
%get_class(F4 ,HISTORY );
%get_class(F5 ,SPANISH );
%get_class(F6 ,FRENCH );
run;
The above code will create 5 output SAS datasets with two variables each. Respondent and one other, see the SAS log excerpt below. I have removed some blank lines. Of course your first statement (as noted elsewhere in these responses) will be I have too many columns and do not want to code them by hand. That of course can be fixed by using either a Proc Contents to an output file and a data step to create the list of macro calls, or using PROC SQL to generate the list of "%get_class" commands. I will not write that code here.
35 %get_class(TOPICS ,ART );
NOTE: There were 5 observations read from the data set TEST.'Sheet1$'n.
WHERE UPCASE(ART)='ART';
NOTE: The data set WORK.ART has 5 observations and 2 variables.
NOTE: DATA statement used (Total process time):
real time 0.14 seconds
cpu time 0.01 seconds
36 %get_class(F3 ,SCIENCE );
NOTE: There were 2 observations read from the data set TEST.'Sheet1$'n.
WHERE UPCASE(SCIENCE)='SCIENCE';
NOTE: The data set WORK.SCIENCE has 2 observations and 2 variables.
NOTE: DATA statement used (Total process time):
real time 0.10 seconds
cpu time 0.01 seconds
37 %get_class(F4 ,HISTORY );
NOTE: There were 2 observations read from the data set TEST.'Sheet1$'n.
WHERE UPCASE(HISTORY)='HISTORY';
NOTE: The data set WORK.HISTORY has 2 observations and 2 variables.
NOTE: DATA statement used (Total process time):
real time 0.08 seconds
cpu time 0.03 seconds
38 %get_class(F5 ,SPANISH );
NOTE: There were 4 observations read from the data set TEST.'Sheet1$'n.
WHERE UPCASE(SPANISH)='SPANISH';
NOTE: The data set WORK.SPANISH has 4 observations and 2 variables.
NOTE: DATA statement used (Total process time):
real time 0.04 seconds
cpu time 0.01 seconds
39 %get_class(F6 ,FRENCH );
NOTE: There were 3 observations read from the data set TEST.'Sheet1$'n.
WHERE UPCASE(FRENCH)='FRENCH';
NOTE: The data set WORK.FRENCH has 3 observations and 2 variables.
NOTE: DATA statement used (Total process time):
real time 0.02 seconds
cpu time 0.00 seconds
40
41 run;
The following code will merge the files with no problem, sorting is not required unless the values of respondent are not in order in the original file.
data full_data;
merge ART SCIENCE HISTORY SPANISH FRENCH ;
by Respondent ;
run;
Proc freq can then do the counting and will produce the following:
proc freq data=full_data;
table respondent*ART / list;
table respondent*SCIENCE / list;
table respondent*HISTORY / list;
table respondent*SPANISH / list;
table respondent*FRENCH / list;
run;
Cumulative Cumulative
Respondent ART Frequency Percent Frequency Percent
ƒƒƒƒƒƒƒƒƒƒƒƒƒƒƒƒƒƒƒƒƒƒƒƒƒƒƒƒƒƒƒƒƒƒƒƒƒƒƒƒƒƒƒƒƒƒƒƒƒƒƒƒƒƒƒƒƒƒƒƒƒƒƒƒƒƒƒƒƒƒ
1 Art 1 20.00 1 20.00
2 Art 1 20.00 2 40.00
3 Art 1 20.00 3 60.00
4 Art 1 20.00 4 80.00
6 Art 1 20.00 5 100.00
Frequency Missing = 1
Cumulative Cumulative
Respondent SCIENCE Frequency Percent Frequency Percent
ƒƒƒƒƒƒƒƒƒƒƒƒƒƒƒƒƒƒƒƒƒƒƒƒƒƒƒƒƒƒƒƒƒƒƒƒƒƒƒƒƒƒƒƒƒƒƒƒƒƒƒƒƒƒƒƒƒƒƒƒƒƒƒƒƒƒƒƒƒƒƒƒƒƒ
4 Science 1 50.00 1 50.00
6 Science 1 50.00 2 100.00
Frequency Missing = 4
Cumulative Cumulative
Respondent HISTORY Frequency Percent Frequency Percent
ƒƒƒƒƒƒƒƒƒƒƒƒƒƒƒƒƒƒƒƒƒƒƒƒƒƒƒƒƒƒƒƒƒƒƒƒƒƒƒƒƒƒƒƒƒƒƒƒƒƒƒƒƒƒƒƒƒƒƒƒƒƒƒƒƒƒƒƒƒƒƒƒƒƒ
1 History 1 50.00 1 50.00
4 History 1 50.00 2 100.00
Frequency Missing = 4
Cumulative Cumulative
Respondent SPANISH Frequency Percent Frequency Percent
ƒƒƒƒƒƒƒƒƒƒƒƒƒƒƒƒƒƒƒƒƒƒƒƒƒƒƒƒƒƒƒƒƒƒƒƒƒƒƒƒƒƒƒƒƒƒƒƒƒƒƒƒƒƒƒƒƒƒƒƒƒƒƒƒƒƒƒƒƒƒƒƒƒƒ
3 Spanish 1 25.00 1 25.00
4 Spanish 1 25.00 2 50.00
5 Spanish 1 25.00 3 75.00
6 Spanish 1 25.00 4 100.00
Frequency Missing = 2
Cumulative Cumulative
Respondent FRENCH Frequency Percent Frequency Percent
ƒƒƒƒƒƒƒƒƒƒƒƒƒƒƒƒƒƒƒƒƒƒƒƒƒƒƒƒƒƒƒƒƒƒƒƒƒƒƒƒƒƒƒƒƒƒƒƒƒƒƒƒƒƒƒƒƒƒƒƒƒƒƒƒƒƒƒƒƒƒƒƒƒ
1 French 1 33.33 1 33.33
4 French 1 33.33 2 66.67
6 French 1 33.33 3 100.00
Frequency Missing = 3
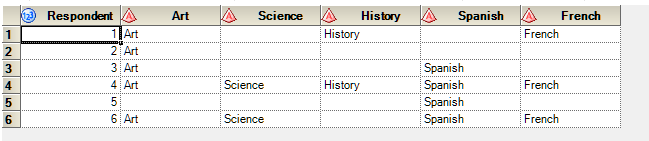
The final SAS table looks like the following:
options firstobs=1;
proc print data=full_data;
run;
libname test close;
Once again I aligned the columns because of proportional spacing of the letters.
Obs Respondent ART SCIENCE HISTORY SPANISH FRENCH
1 1 Art History French
2 2 Art
3 3 Art Spanish
4 4 Art Science History Spanish French
5 5 Spanish
6 6 Art Science Spanish French
The SAS dataset generated here (as Full_data) and shown as the printed output above should be the answer to your question. I have also attached the code.

- Mark as New
- Bookmark
- Subscribe
- Mute
- RSS Feed
- Permalink
- Report Inappropriate Content
With data like this I tend to 1) save as CSV for input to SAS and 2) make custom informats so that when the data is read Art is treated as 1 for the Art variable and 0 if not selected (for multiple response variables).
Using CSV usually a brief examination shows which row the data starts on so I can set firstobs on a file statement, and the columns should be relatively consistent so I know that the first variable is the respondent ID, the second is the "want to take art" variable, third is "want to take science and so forth.
If there is NO possibility for the ART response to occur in a different column you could even likely get by with a common informat.
proc format;
invalue Topic
'Art','Science','History','Spanish','French' = 1
other = 0;
run;
data raw;
infile "filename" dlm=',' dsd ; /* remember I said I saved the Excel as CSV*/
informat respondent best8.;
informat Art Science History Spanish French Topic. ;
input respondent Art Science History Spanish French;
run;
With 0/1 coded variables then the SUM of a question is the count of yes and the mean is percent yes. Personally I would prefer to have the individual variables. It makes it so much easier to answer questions like "How many students wanted both Art and Science" as a quick data step can create the composite variable (addition: Value 2= Both 1= only 1 and 0 = neither, a custom format again could display similar text for those values). Plus modeling of other sorts works way better with one record per respondent in general.
A brief summary:
proc tabulate data=raw;
var Art Science History Spanish French;
table Art Science History Spanish French ,
Sum='Yes'*f=best6. mean='% Yes'*f=percent10.2;
run;
.jpg")
Catch up on SAS Innovate 2026
Nearly 200 sessions are now available on demand in the Innovate Hub.
Watch Now →Need to connect to databases in SAS Viya? SAS’ David Ghan shows you two methods – via SAS/ACCESS LIBNAME and SAS Data Connector SASLIBS – in this video.

Find more tutorials on the SAS Users YouTube channel.
-
6 replies
-
05-18-2015 12:28 PM
-
3165 views
-
0 likes
-
5 in conversation
-
