As SAS Visual Analytics users – and proponents of data visualization in general – you appreciate the ability to put analytical insights in front of “consuming” users to make better decisions. “Consuming” users could be executives or directors or front-line staff like branch managers or online sales representative.
To get information in front of this set however, many of you rely on or collaborate with the “producing” users – those involved in exploring data and designing and building predictive models on a daily basis. “Producers” could be researchers, data scientists, statisticians, data miners, or business analysts, for example.
While there’s a need to expand this pool of core “producers,” it’s important for more marketing analysts, risk analysts, functional experts, and analytically “new” users (Gartner has recently called them “citizen data scientists”), to create and refine models as well. SAS Visual Statistics helps on this front.
If you haven’t heard about SAS Visual Statistics, let’s start with a quick overview.
- First, SAS Visual Statistics is an add-on product to SAS Visual Analytics.
- Second, it offers Web-based interactive, drag-and-drop interface that helps you build descriptive and predictive models. It takes advantage of SAS LASR Analytic Server for in-memory computations.
- Lastly, and importantly, it is now fully integrated and delivered through the SAS Visual Analytics Explorer 7.2 interface for a common end-user experience. This approach allows you to explore data before building or refining models. You can also explore the results (e.g. predicted values, labels, cluster ids) after building or refining models.
How do you start?
Begin in SAS Visual Analytics Explorer to analyze a number of areas including:
- Investigating the distribution of different variables.
- Understanding relationships among variables.
- Handling basic data manipulations, variable formatting and apply filters.
Then utilize SAS Visual Statistics for:
- Interactively building an analytical model directly from a chart (Scatter plot, Box plot, Heat Map & Correlation matrix) in only two clicks.
- Optionally stratifying the models to isolate specific segments.
- Developing challenger models and comparing multiple models to select a champion.
- Exploring the modeling results (e.g. predicted values, labels, cluster ids)
- Saving scoring code to score new customer cases.
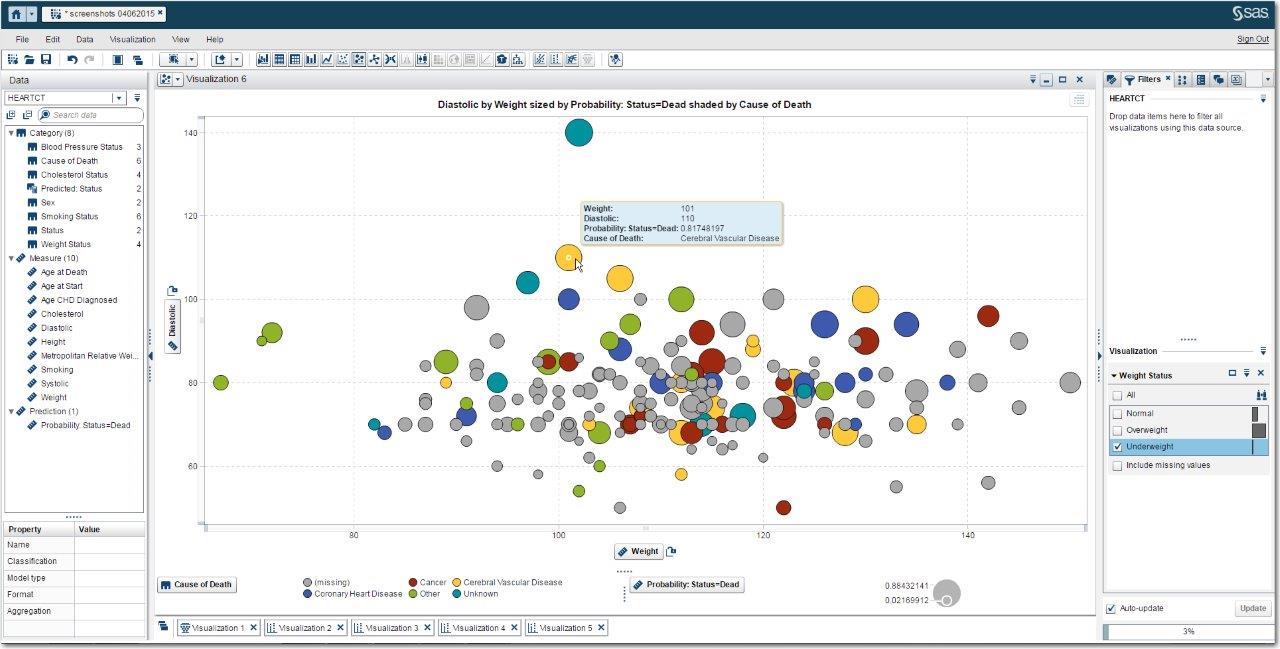
Sample SAS Visual Analytics exploration
(click to enlarge)
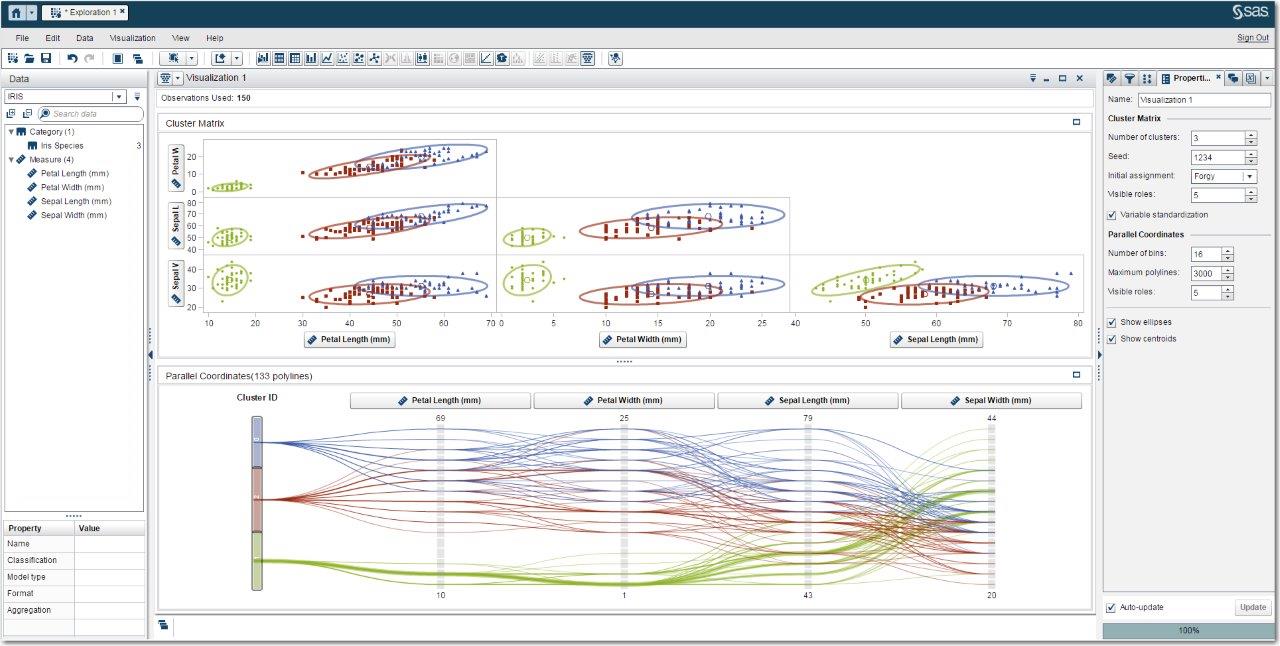
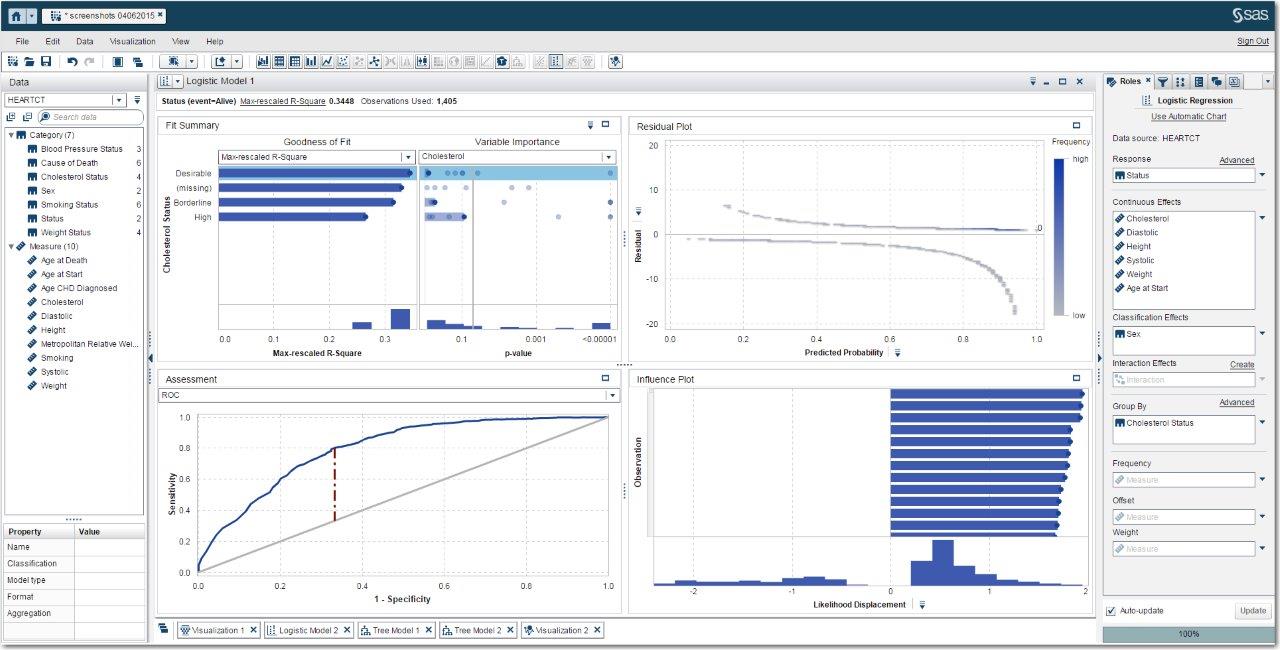
Sample SAS Visual Statistics models
(click to enlarge)
(click to enlarge)
Key capabilities of SAS Visual Statistics:
- Predictive Modeling Techniques.
- Linear regressions.
- Logistic regressions.
- Generalized linear models.
- Descriptive Modeling Techniques.
- Clustering.
- Classification trees.
- Dynamic Group-by Processing
- Model Comparison and Assessment.
- Model Score Code.
With a combined, fully integrated data discovery (i.e., SAS Visual Analytics) and predictive modeling (i.e., SAS Visual Statistics) approach, you can improve collaboration and productivity of “producers” and “consumers.”
Want to give SAS Visual Statistics a whirl? Try it out and let us know what you think.

