Once you have come up with a good predictive model, the next step is to use it in a strategy that helps your business work better and more efficiently. Some strategies involve moving the cutoff to consider an observation a predicted event. By default, the cutoff for predicted probabilities is set at 0.5, which means that an observation with predicted probability of event greater than 0.5 is considered a predicted event. The below example shows how to move the cutoff to any given value, and also how to find a cutoff that makes the most sense in terms of rates for true positives and true negatives.
What’s the data?
Let’s say you are in charge of designing a strategy to collect early payments from customers with a high probability of default on their credit. The sample data set German Credit contains inputs to model a binary target called good_bad, which flags all customers that defaulted on their credit payments.
Example 1: User Input Cutoff
Suppose that you have limited resources for your strategy in terms of budget and the number of agents you can assign to look after customers with a high predicted probability of default.
In Enterprise Miner, you can select a cutoff in several ways, one being to set it manually. This is called a user input cutoff.
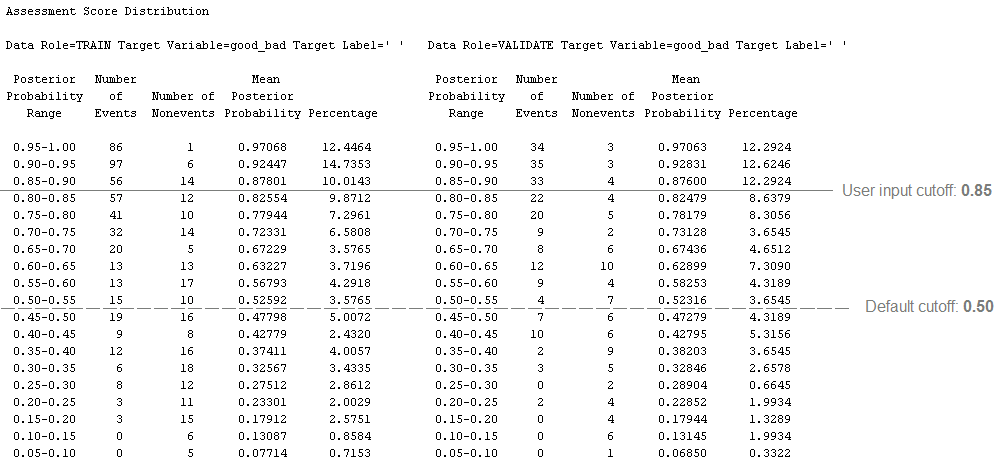
After you have created the flow for this example (details in the Appendix section), open the results for your regression model. Use the Assessment Score Distribution to come up with a small group that captures a good number of events. For this example, it seems like a good business decision to consider all records with predicted probabilities greater than 0.85 as an event. Why? As shown in the figure below, the observations above this cutoff add up to a good percentage of the observations in this data set, and the number of nonevents are lower than the number of events. This means that a 0.85 cutoff gets you a strategy for the 36% riskier customer segment, with a relatively low rate of nonevents (false positives).
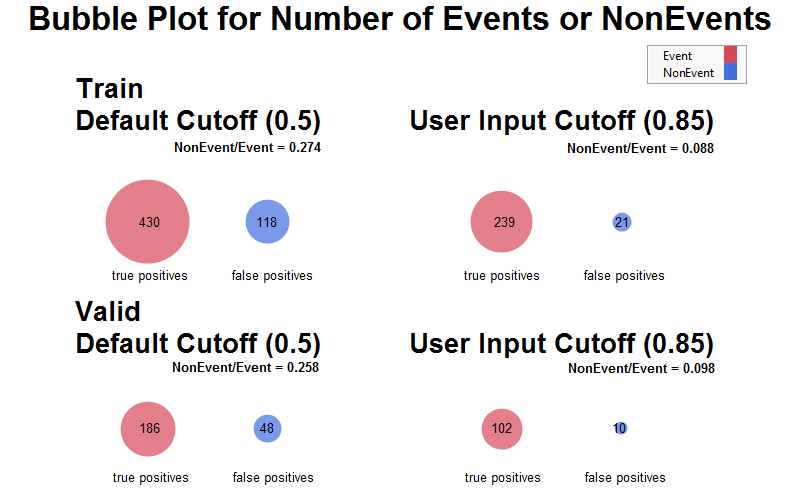
A good way to represent the size of the strategy with your new cutoff, and the nonevent to event ratio, is to reorganize the score distribution information into a bubble plot. Notice that the number of observations above the 0.85 cutoff is half the size of the observations above the default 0.5 cutoff. At the same time, a 0.85 cutoff also gives you a better nonevent to event ratios. This means that, for this example, you have a smaller group that also has a higher rate of true positives when you use a cutoff of 0.85 instead of the default cutoff.
To set this user input cutoff in SAS Enterprise Miner, add a Cutoff node to your diagram, then set the user input cutoff as 0.85. This will make all your reports and scoring code predict an event if the predicted probability is greater than 0.85.
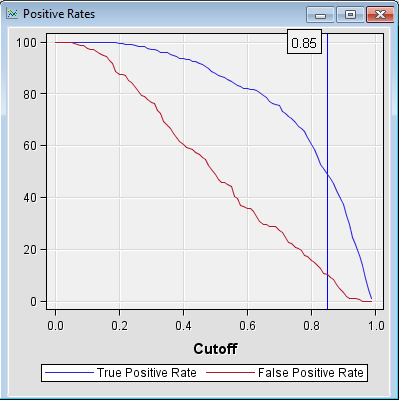
The 0.85 cutoff from this example enables you to capture around 60% of the true positive events with less than 10% of the false positives.
Example 2: Additional Cutoff Options
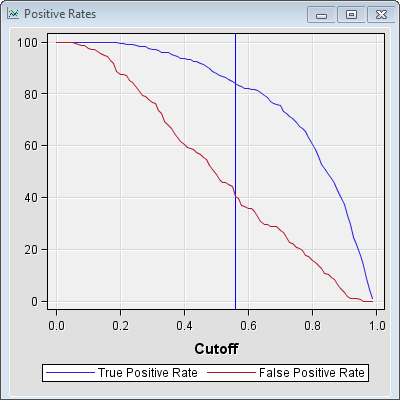
The Cutoff node also has some other options for you to determine a good cutoff for your predicted probabilities. A useful one is the Event Precision Equal Recall method, which finds the cutoff where the Event Precision Rate and the True Positive intersect. In this example they intersect at 0.56.
Remember that the Event Precision Rate is defined as the count of true positives divided by the count of predicted positives. With this method you are choosing the cutoff such that the event precision rate of your model equals the percentage of captured true positives.
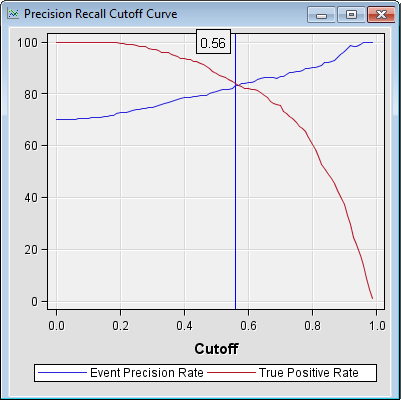
Notice that this cutoff enables you to capture more than 80% of the true positive events, with only less than 40% of the false positives.
Conclusion
The first example walks you through a cutoff strategy you might want to use when you have a limited budget and you need to create a strategy for a small group of individuals that have a high event probability. Another common scenario for user input cutoffs is modeling rare target events.
If you have access to more resources, you might want to choose the Event Precision Equal Recall cutoff method to find a more appropriate cutoff, as discussed in the second example.
Find more information on how to interpret other useful graphs and results from the Cutoff node in the SAS® Enterprise Miner™ Reference Help.
Appendix
To reproduce this example, you can download the XML attached, and import it through the File menu (File->Import diagram from XML).
Alternatively, you can build this diagram flow from scratch following these steps:
- Generate the German Credit data set by going to Help->Generate Sample Data Sources. Select German Credit and click OK.
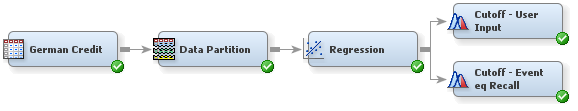
- Create a diagram like the below by adding the German Credit data source, followed by a Data Partition node (70.0 for training and 30.0 for validation), a Regression node, and two Cutoff nodes.