Process flow diagrams are a great way to create and visualize a data mining process. But you probably find that after working on a process flow for a while it tends to get cluttered, even to the point where connections between nodes seem to run in every direction.
Cluttered diagrams can be harder to follow and more difficult to work with than clean, well-organized diagrams. But the Control Point node can help. The Control Point node, available in the Utility menu, allows you to reduce the total number of connections between nodes, run parallel flows or branches with a single gesture, and even transform your flows into reusable templates.
Examples
1. Eliminate unnecessary connections
The Ensemble node in SAS® Enterprise Miner™ allows you to build an ensemble model from several component models. In many cases, ensembles provide better lift or generalizability than the individual component models that make up the ensemble.
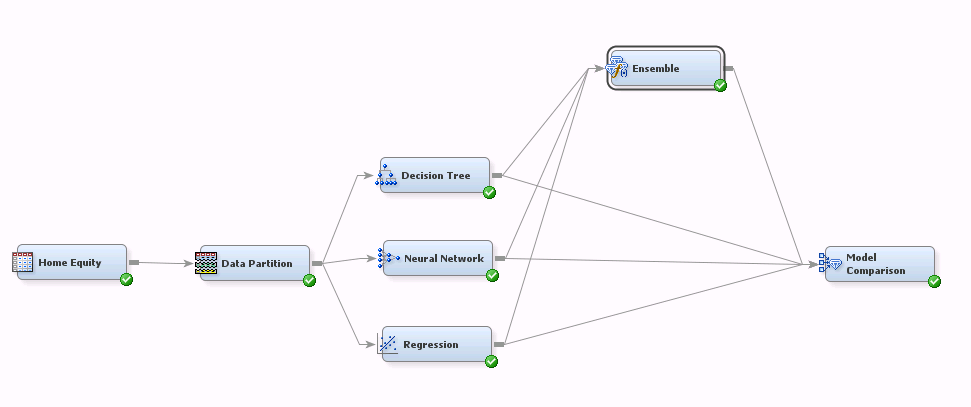
Ensemble Flow
This flow builds three models (Decision Tree, Neural Network, and Regression) to predict loan default and compares them using the Model Comparison node. It also compares a fourth model, which is an ensemble comprised of the three individual models.
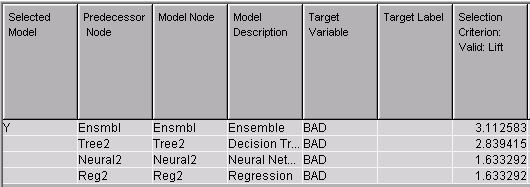
Model Comparison Results
There is nothing wrong with this flow--it certainly does the job. But note that there are connections from the Data Partition node to each modeling node, from each modeling node to the Ensemble node, and from each modeling node to the Model Comparison node. If you wanted to try using different modeling algorithms (adding and removing modeling nodes from your ensemble), you would have to manage three sets of connections per modeling node. That could get tedious.
Here’s a better way:
Instead of connecting each modeling node directly to the Ensemble node, connect each to a Control Point node. Then connect the Control Point node to the Ensemble and Model Comparison nodes:
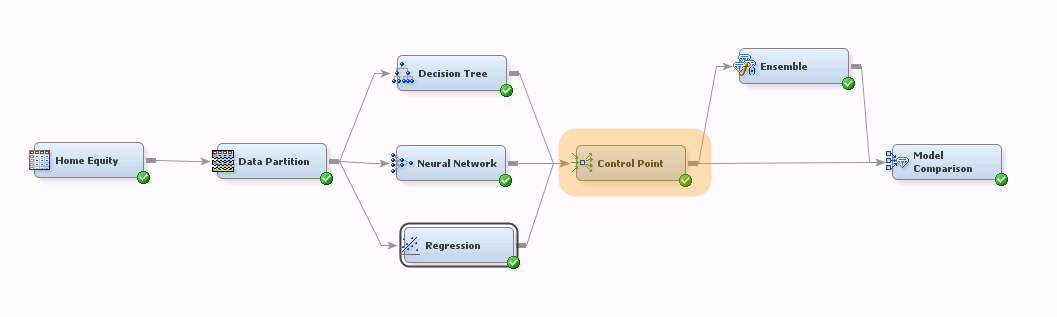
The revised diagram does the same thing as the earlier version of our flow: it compares the three component models with the ensemble. But we have managed to eliminate some connections, simplifying the diagram.
What exactly does the Control Point node do here? Well, it doesn't produce any results. Rather, it has split the flow into two independent subflows--an upstream portion that builds component models and a downstream portion that ensembles the component models. In other words, we've encapsulated the modeling portion of the flow so the downstream part doesn't need to change when component models are added or removed.
2. Run modeling multiple flows at once
Here’s a simple flow that generates four predictive models:
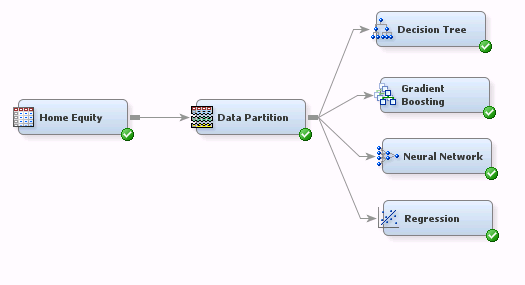
Pretty simple stuff. But to run each of the models you need to click on each modeling node and run it individually. And if you later decided to override the default partition specifications or add a Transformation node upstream of the modeling nodes, you’d need to repeat the process, re-running each modeling node one at a time.
Here’s a better way. Simply add a Control Point to the end of your flow:
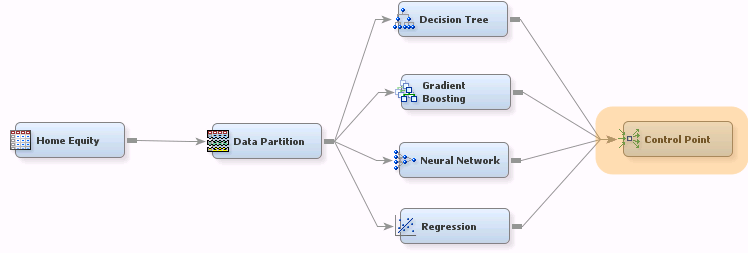
Now to build all four models (and any predecessor nodes), you only need to run the Control Point node.
The same logic applies with more complicated flows. For example:
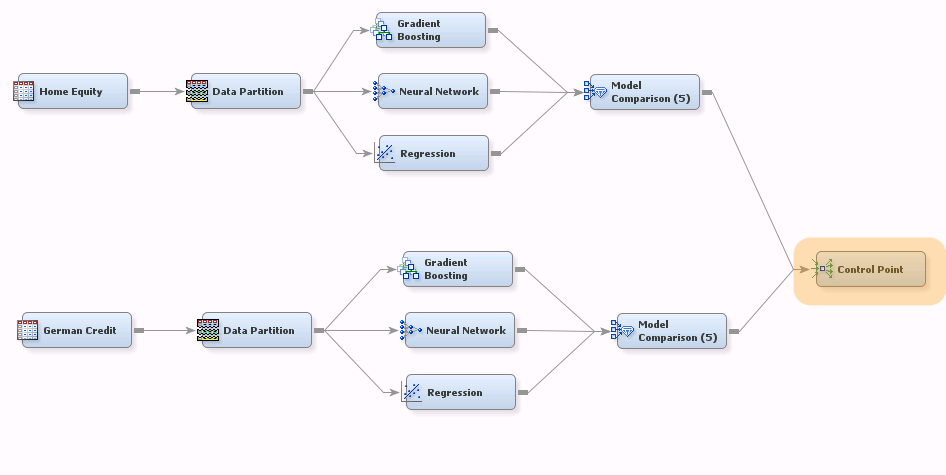
Here, running the Control Point node runs both of the modeling building paths with a single gesture. That’s really handy when you want to start a big job and let it run unattended--it saves you from having to intervene after each subflow has finished to kick off the next subflow.
3. Swap datasets
When you are ramping up on a new data mining technique, just trying to understand how things work, you may find yourself running the same flow on different datasets. Of course, this is also the case when you retrain your production models using a new dataset.
Here, for example, I’ve built a simple flow to model the German Credit data (target=good_bad):
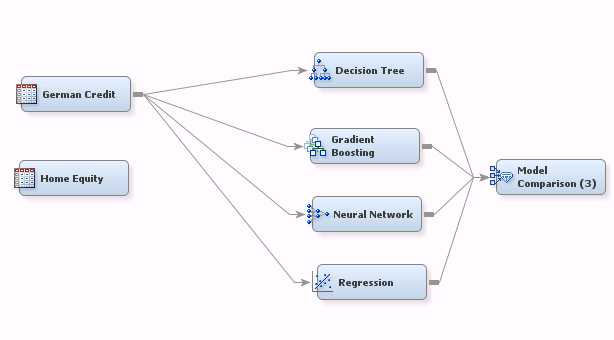
Suppose I’ve run the above flow and now want to see what happens with the Home Equity dataset. Before I can do so, I have to remove the four connections from the German Credit dataset to the modeling nodes and establish four more.
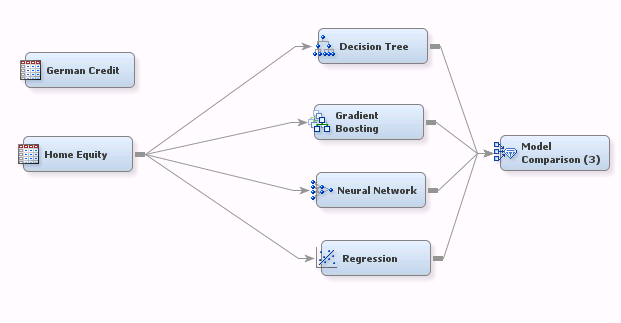
At least having the Model Comparison node at the end of the flow avoids the need to rerun each model individually. But here is a better way:
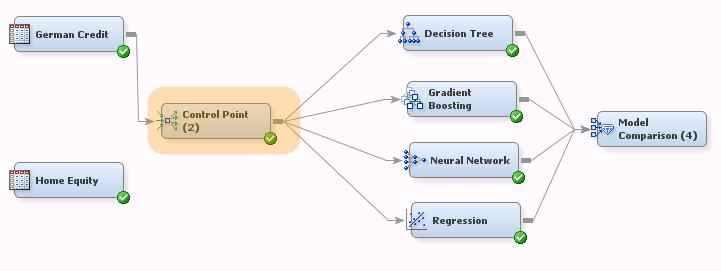
This version makes it easy to switch input datasets. You would simply disconnect German Credit from the Control Point node then connect the Home Equity node to the Control Point node. You only need to manage one connection when swapping datasets.
Note that we’ve essentially created a "headless" diagram--a diagram template where the user only needs to choose the input dataset and run the flow.
Summary
Cluttered diagrams are much like cluttered programming code—inelegant and hazardous to your productivity. The Control Point node can help by simplifying your diagrams and encapsulating subflows so they work essentially independently of each other. With complicated flows, judicious use of the Control Point node could save you a lot of headaches.
The Control Point is very much a convenience feature—it analyzes no data, and produces no results. But nonetheless a very useful node to have in your data mining tool box.

