- Home
- /
- SAS Communities Library
- /
- Tip: How to interpret your SAS® Rapid Predictive Modeler results
- RSS Feed
- Mark as New
- Mark as Read
- Bookmark
- Subscribe
- Printer Friendly Page
- Report Inappropriate Content
Tip: How to interpret your SAS® Rapid Predictive Modeler results
- Article History
- RSS Feed
- Mark as New
- Mark as Read
- Bookmark
- Subscribe
- Printer Friendly Page
- Report Inappropriate Content
Rapid Predictive Modeler is really useful. In just a few clicks, you can create a model that serves as a great starting point for any data mining project. You can then tweak this model into a better predictive model that suits your needs. Plus, the report it generates helps you understand the main drivers of your RPM model.
In this article, you’ll learn how to interpret the results of your RPM model. If you’re looking for a guide on how to import your RPM model into SAS Enterprise or just want to learn more about RPM, check out 's article .
Data
For this example, imagine that you need to create a model using RPM to identify customers who have a high probability of defaulting on their credit payments. The data set you will use is the German Credit table found in the library sampsio. This sample data set contains inputs to model a binary target called good_bad, which flags all customers that defaulted on their credit payments.
Rapid Predictive Modeler Results
Once you have run your rapid predictive model, open the PDF report that it generates. You will find several summary tables and graphs for your model.
The tables and graphs in your report help you understand the model that was selected. This means that different settings of RPM on the same data set will give you different tables and graphs as your report depends on the final model that RPM selected, not on your data set.
Selected Variable Importance and Cross Tabulations Scorecard
Two of the most useful summary results are the Selected Variable Importance and the Cross Tabulations Scorecard. The Selected Variable Importance graphic shows you which variables contribute the most to your chosen model whereas the Cross Tabulations Scorecard helps you determine which values within those significant variables have the most effect. These two reports used together provide you with the whole picture about which variables, and which values within that variable drive your RPM model.
How does Rapid Predictive Modeler Calculate Selected Variable Importance?
The variable importance in this plot is calculated using a decision tree algorithm to explain the predicted outcome variable of your RPM model. By default, the predicted outcome I_<target> (i_good_bad in this example) is used as target and all variables flagged as significant in the selected model as inputs. When you specify a decision matrix, the decision outcome chosen by the model (d_good_bad in this example) is used.
This plot is particularly useful to explain black box models like neural networks or support vector machines. RPM’s tree-based variable importance will not necessarily match the variable importance of methods that already calculate variable importance like regression, random forest, gradient boosting, etc.
Selected Variable Importance Interpretation
Take a look at the Selected Variable Importance of this example. It indicates that there is one variable that is very significant in your model. The variable checking (years with checking account) is a very strong driver in your model to predict payment default. This information is very useful to us; we can now use it to dictate adequate delinquency policies and create new strategies for cross-sale and customer retention.
Checking isn't the only important variable here. Several other variables contribute to your predictions and you’ll want to take a closer look at them, especially history, duration, amount and savings.
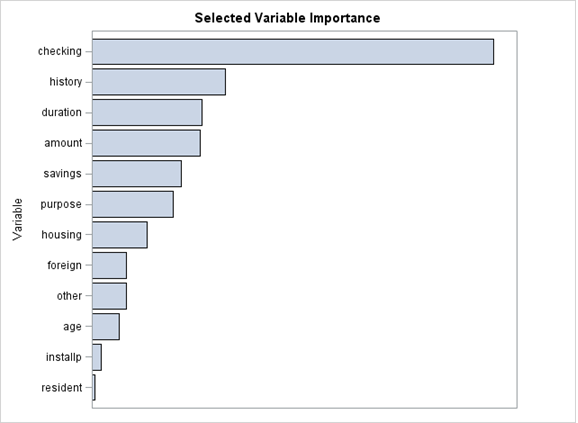
Figure 1. RPM Selected Variable Importance graph
How does Rapid Predictive Modeler create the Cross Tabulations Scorecard?
The variables are first binned by the same decision tree algorithm used to determine the Selected Variable Importance above. Next the binned variables are used as inputs to a regression model using the predicted outcome as target. By default the regression uses i_<target> as the dependent variable, or d_<target> if you specified a decisions matrix. In our example, the regression uses the binned inputs of the german credit data set to explain the variable i_good_bad calculated by the selected RPM model.
The scorecard points are calculated through a scaling that starts by identifying the lowest parameter estimate of the regression within a binned variable. This value is assigned a score of 0 and will be used as a reference value. The scorecard points for all other binned levels are scaled based on the difference between the parameter estimate of that bin and the parameter estimate of the reference level. The scorecard points values range from 0 to 1000 and increase as the difference between the parameter estimate and the reference parameter estimate increases. The more similar the parameter estimates across all binned levels within a variable, the closer they will be to 0. On the other extreme, if there is a binned level that explains most of a variable, and has a very high parameter estimate compared to the other binned levels, the associated score will be closer to 1000.
Cross Tabulation Scorecard Interpretation
When interpreting the scorecard for Rapid Predictive Modeling results, you’ll have to make a clear distinction between a scorecard generated through SAS Credit Scoring for SAS Enterprise Miner and one from RPM. These two scorecards are not the same. The scorecard produced by the Scorecard node is a true scorecard in the sense that points are generated in terms of certain scaling properties, and are comparable across variables.
Since the scorecard from Rapid Predictive Modeler is based on a different scaling algorithm, the points from one variable are not comparable to the points of another variable. However, Rapid Predictive Modeler Cross Tabulation Scorecard gives you a clear notion of the relationship of certain values of your inputs with the event you are modeling.
Once you have identified significant variables from the Selected Variable Importance graphic above, you’re now able to dive deeper and determine what specific values, or range of values, are controlling the significance of the variable.
In our example, you learned that the variable checking (years with checking account) was the most important variable in your RPM model. You can now look to the Cross Tabulation Scorecard and use the scorecard points to notice that the higher the number of checking accounts, the lower the chances of a customer being bad. You can also notice this relationship by comparing the 43.54% bad rate for bin 1 to the 20.57% bad rate of bin 3. Notice as well that there are twice as many customers in bin 3, compared to bin 1, which is an indicator of a good quality portfolio.

Figure 2. Partial screen of RPM Cross Tabulation Scorecard
Conclusion
This example helps you understand better the algorithms and the logic behind two of the most useful results generated by the SAS Rapid Predictive Modeler. You should also be more familiar with the advantages and limitations of these results, and how to use them together to gain better insights about your selected model.
If you find this tip helpful, have any questions, or simply want to share your thoughts, please comment below.
- Mark as Read
- Mark as New
- Bookmark
- Permalink
- Report Inappropriate Content
Very useful document to all RPM users. Could you please verify this statement:
"The variables are first binned by the same decision tree algorithm used to determine the Selected Variable Importance above"
Based on the RPM workflow diagram I was under the impression RPM is using the interactive binning node ( Not DT to do the binning).
Thanks
- Mark as Read
- Mark as New
- Bookmark
- Permalink
- Report Inappropriate Content
Hi,
When you say "Based on the RPM workflow diagram", you mean you ran RPM, then imported its model XML back into 'regular' EM, and you see one interactive binning node is engaged in the RPM workflow, right? Thanks.
- Mark as Read
- Mark as New
- Bookmark
- Permalink
- Report Inappropriate Content
Dear G C J,
Thanks for your comment!
Your path may vary depending on your data, and on the RPM task you select (basic, intermediate, or advanced).
These results (variable importance graph and cross tabulations scorecard) are actually generated on the Reporter node at the end of your diagram flow, whether or not you have a node that does binning or grouping in your diagram.
As a follow up tip, you can use the Reporter node to generate these results for any model node.
To do that:
1. Connect a Score node, and a Reporter node to any model node.
2. Specify the nodes property of your Reporter node as summary.
3. Run your diagram flow, and open the results. Click on View to open the pdf from the Reporter node.
You will find the same report that RPM generates. Notice that a decision tree ran behind the scenes to both calculate the variable importance of the inputs of your model related to the predicted probability of event, and to bin the inputs of your model for the cross tabulation scorecard.
Does this answer your questions?
Best regards,
Miguel
- Mark as Read
- Mark as New
- Bookmark
- Permalink
- Report Inappropriate Content
The RPM workflow diagram I mentioned above is when you create a RPM project using BASIC option in EG and open this project in EM.
According to Miguel, the Variable Importance statistics and the binning of all predictors used in Cross Tabulation Scorecard table are generated by the report node with summary option using decision tree (DT) node. Thank you for the clarification Miguel.
Is there a reason for using DT ( I assume separate DT model is needed for each binning) over using interactive binning ( all binning can be achieved within one node) within the report node?
- Mark as Read
- Mark as New
- Bookmark
- Permalink
- Report Inappropriate Content
You use a decision tree because you need a model, not just groupings. For the case in our example you are using a decision tree to model the target p_good_bad using all your inputs to determine what inputs were the most important in modeling the target good_bad.
The decision tree algorithm (proc arbor) running behind the scenes of Reporter node does all these three tasks at once:
-it builds a model based on the predicted probability event of your modeling node (the p_<target> calculated by the model node you used right before the Score node and the Reporter node)
-it calculates the variable importance, and the binning of the input variables
-you do not need to build separate decision tree models. The way it works, proc arbor has the option to output the splitting rules into a file. In this file, the selected split is labeled as "primary", and all other candidate splits are ranked as "competitors". This file contains all the information of both the split that was selected, and the splits that could have been selected. This means that in just one proc call, you get all the information you need to create bins for your variables.
I hope this helps,
Miguel
- Mark as Read
- Mark as New
- Bookmark
- Permalink
- Report Inappropriate Content
Miguel, Thank you very much for your responses related to my binning method question used in the output created by the report node with summary option.
This is my understanding regarding what is going on when producing output using REPORT node with the summary option:
1) The variable importance plot is produce by running PROC ARBOR with default setting (?) using the p_<target> as the target and all inputs. The variable importance chart displayed is based on the variance importance table produced by PROC ARBOR.
I agree with you in this point.
2) Cross Tabulation Scorecard using binned variables- My understanding: This table is produced from the rescaled parameter estimates generated from DMREG using all optimally binned inputs with one of the selection method (Stepwise?). (DMReg is not using the variable selected by PROC ARBOR). I am not sure whether you agree with this point - Please confirm
3) Binning the input: According to your posting, the same PROC ARBOR step used to create variable importance is used to create binning of all input variables. I disagree with you regarding this point because of the following:
- In your example 12 inputs are identified based on PROC ARBOR variable importance. The variables coapp and depends were not identified as importance based on PROC ARBOR. That means these two variables were not binned based on PROC ARBOR. However, Cross Tabulation Scorecard table includes scorecard points for these two variables. This confirms that some other method was used in binning all inputs.
- My guess: optimal binning node is used to create the binning of all inputs and then passes all the binned inputs to REGRESSION node.
- Furthermore, I am not sure how can you produce binned inputs from a single DT run using all the output tables generated from a single PROC ARBOR run.
Because I couldn't find any documentation regarding the RPM model steps, these are my guesses based on the discussion I had with my colleagues. If my observations are incorrect and if you have any other resources available to validate your claim please share with me.
Thanks
George Fernandez
.jpg")
Catch up on SAS Innovate 2026
Nearly 200 sessions are now available on demand with the SAS Innovate Digital Pass.
Explore Now →SAS AI and Machine Learning Courses
The rapid growth of AI technologies is driving an AI skills gap and demand for AI talent. Ready to grow your AI literacy? SAS offers free ways to get started for beginners, business leaders, and analytics professionals of all skill levels. Your future self will thank you.
- Find more articles tagged with:
- enterprise_miner
- rapidpredictivemodeler
- rpm
- tips&tricks
