- Home
- /
- SAS Communities Library
- /
- Tip: How to build a scorecard using Credit Scoring for SAS® Enterprise...
- RSS Feed
- Mark as New
- Mark as Read
- Bookmark
- Subscribe
- Printer Friendly Page
- Report Inappropriate Content
Tip: How to build a scorecard using Credit Scoring for SAS® Enterprise Miner™
- Article History
- RSS Feed
- Mark as New
- Mark as Read
- Bookmark
- Subscribe
- Printer Friendly Page
- Report Inappropriate Content
Credit scorecards have been the standard model for credit scoring because they are easy to interpret and enable you to easily score new data – that is, calculate a credit score for new customers. This tip walks you through the basic steps to build a credit scorecard developed using Credit Scoring for SAS® Enterprise Miner™ and is the first in a series of tips that I will be posting on credit scoring.
Building a Scorecard
The nodes in the basic flow diagram to build a credit scorecard are: Input Data Source, Data Partition, Interactive Grouping, and Scorecard. For this example you can use the German Credit data set available in the Help menu of SAS Enterprise Miner. Click on Help->Generate Sample Data Source -> German Credit. This data set has a binary target good_bad that indicates whether a customer defaulted on his monthly payments (designated with the value 'BAD'), as well as several other variables related to demographics and credit bureau that serve as inputs, or characteristics, .

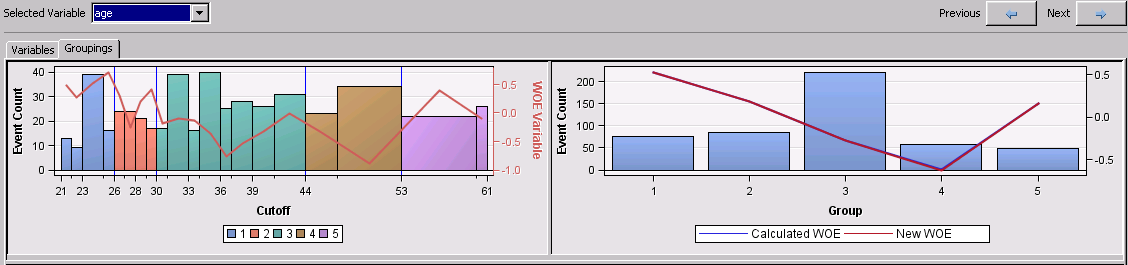
Interactive Grouping Node
In a nutshell, the interactive grouping node is a very flexible tool for binning or grouping your variables. This node:
- bins your input variables using options you can easily tweak
- calculates the weight of evidence of the bins for each input variable
- calculates Gini and Information Value, and rejects input variables with a low value of these statistics
The procedures running behind the scenes find the optimal binning of the inputs with respect to the target, subject to certain constraints that you can easily customize. Make sure you use the interactive application of the node to visually confirm that the event counts and weight of evidence trend make sense for your binning. If necessary, you can merge bins, create new groups, or manually adjust the weight of evidence.
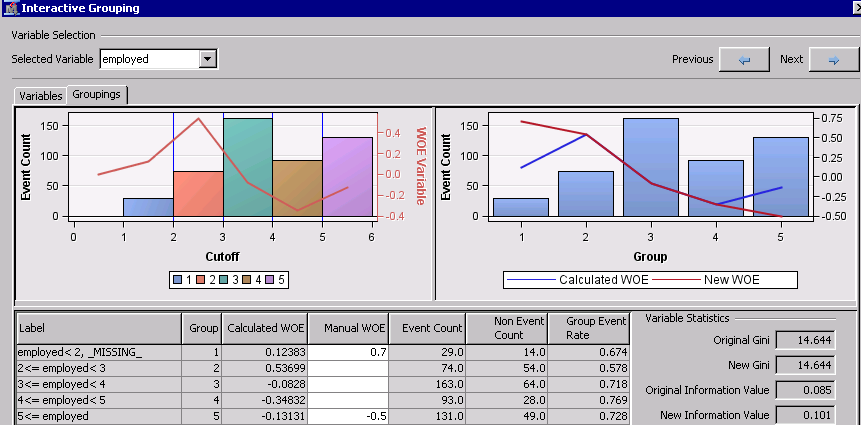
Manually adjusting the Weight of Evidence
For certain variable inputs you might need to manually adjust the weight of evidence (WOE). For example, the variable employed summarizes the number of years that a credit applicant has been employed at his current job. In general, years at current job tends to be proportionally inverse to credit default. The fact that the weight of evidence does not decrease monotonically for groups 1 through 5 on this data set can be due to a number of reasons. For example, this data set might be sample-biased because many applications with employed<2 were hand selected or "cherry-picked", and their good behavior is reflected in a low event count and low weight of evidence. To prevent this sample bias from affecting your scorecard you can use the Manual WOE column on the Coarse Detail view of the Groupings tab in the interactive application. Change the WOE from 0.1283 to 0.7 for group 1 and from -0.13131 to -0.5 for group 2. Notice that the new weight of evidence is plotted as New WOE and the information value is re-calculated as New Information Value.
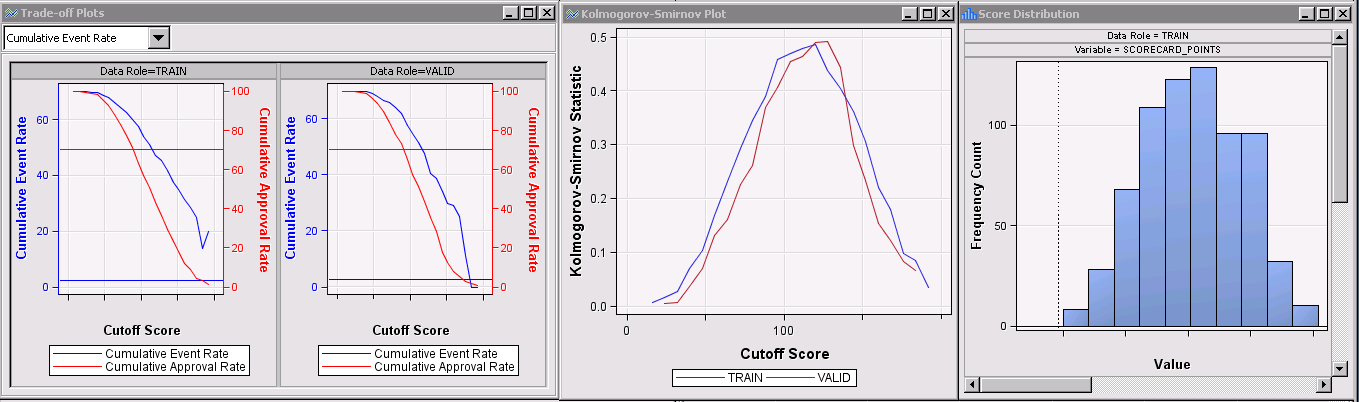
Scorecard Node
Once you are satisfied with the bins or groups you found with the Interactive Grouping node, run the Scorecard node to model a logistic regression using your grouped inputs. Then it will create a linear transformation of the predicted log of the odds for each input group, or attribute, into scorepoints that are much easier to interpret.
By default, with each increase of 20 scorepoints, the odds of the event double. The event you are modeling is payment default, which means that for example an application scored with 130 points has double the odds of defaulting compared to an application with score of 150.
In the results, there are several useful plots and tables including the scorecard, the score distribution, the KS plot, the trade-off plot, and many others.
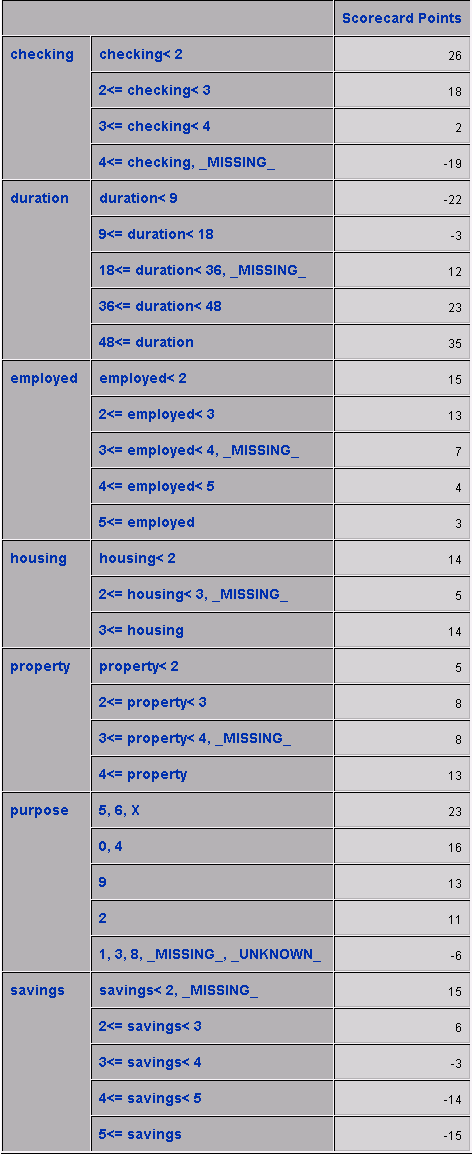
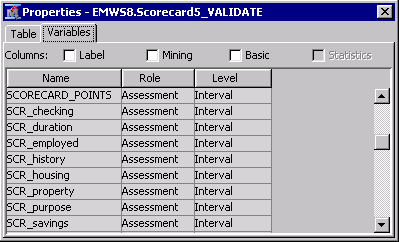
Output variables and Adverse Characteristics
Notice from the exported data sets that the Scorecard node creates several variables. The variables with prefix SCR_ are the scorecard points for each variable in the scorecard, and SCORECARD_POINTS is the total points for each application.
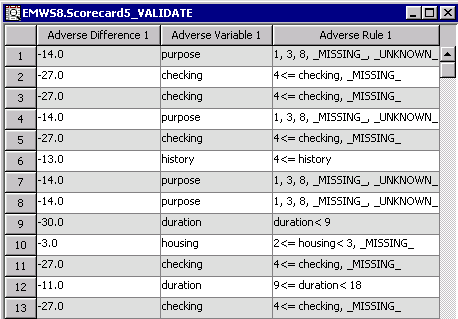
When you specify the Scorecard property Generate Report=Yes to output the Adverse Characteristics, your results will also include the variables that decreased the scorepoints the most for each observation. You can select up to 5 adverse characteristics. As an example of how to interpret this columns, for the first observation on the data set below, 14 scorepoints were deducted because the purpose of the loan was labeled either 1, 3, 8, missing, or unknown.
Recommended reading
- SAS Enterprise Miner Reference Help: SAS Credit Scoring
- Siddiqi, Naeem, Credit Risk Scorecards: Developing and Implementing Intelligent Credit Scoring, Cary, NC: SAS Press, 2005.
- Mark as Read
- Mark as New
- Bookmark
- Permalink
- Report Inappropriate Content
Hello! I hace a problem
In the Miner and Credit Scoring license:
With financial data, we created a credit scoring model. At last we arrived was the Scorecard. What we want now with the data of another month of the same financial, evaluate the model, evaluate the % correct prediction. And to see the ID of each person's financial, evaluate the result of credit scoring with what really happened. you could help me?
thanks
- Mark as Read
- Mark as New
- Bookmark
- Permalink
- Report Inappropriate Content
I think the response to another post will help you: https://communities.sas.com/message/275308#275308
You would use approach described in #2 for using the Model Import node, where you first register the model from the Scorecard node (either use the Register Model node or right-click on the Scorecard node and select Create Model Package, then register it from the Model Packages folder in the Project Panel). Then create a data source for the new data you want to score, set up a flow IDS > Model Import with this new data, with Import Type=Registered Model and the Scorecard model that you registered selected for Model Name.
- Mark as Read
- Mark as New
- Bookmark
- Permalink
- Report Inappropriate Content
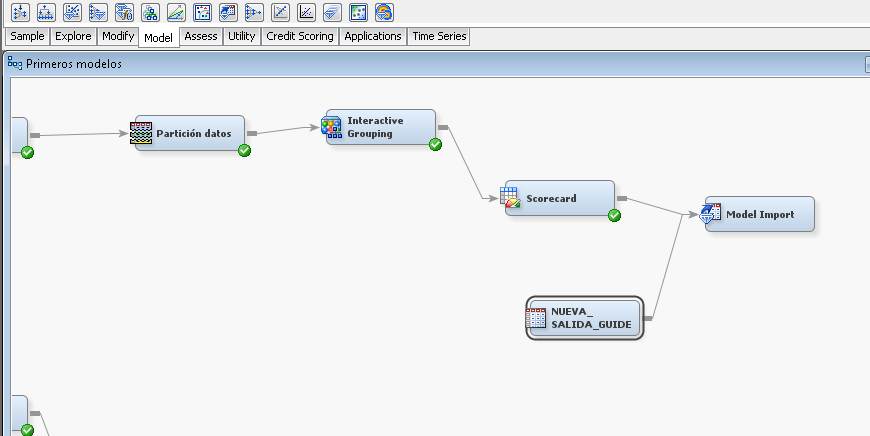
I do not understand the process well. I have the scorecard node, but I don't know how to connect the new data source (that new data source in which I want to validate the prediction %).Is this as in the attached image or am I wrong?
- Mark as Read
- Mark as New
- Bookmark
- Permalink
- Report Inappropriate Content
Almost - the connection from Scorecard to Model Import is not needed. You do need to register the Scorecard model though as I described above.
And there is actually a simpler way that didn't occur to me at first. Just connect your Input Data node with your new data source, with Role=Test, to the Interactive Grouping node then re-run the Scorecard node.
- Mark as Read
- Mark as New
- Bookmark
- Permalink
- Report Inappropriate Content
Mendy thank you very much! You're being a great help for us
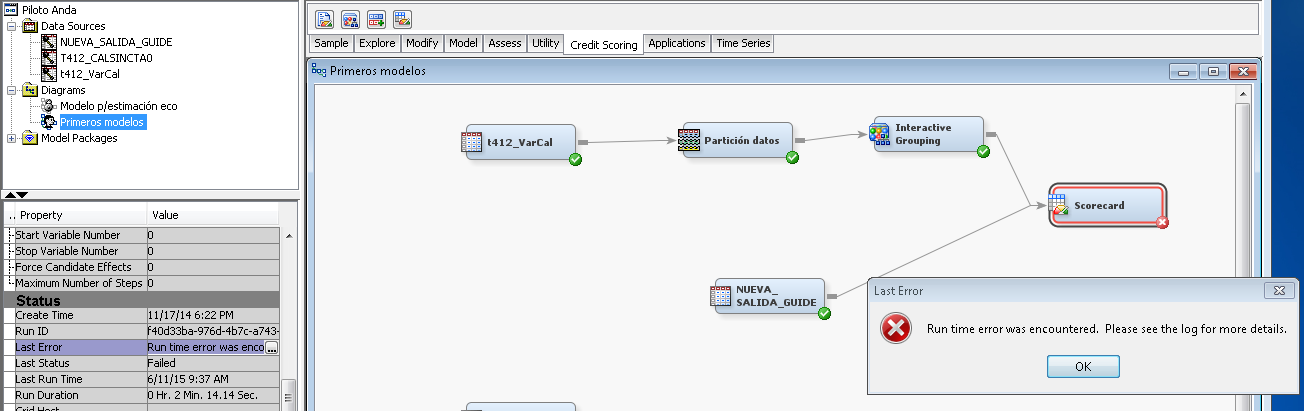
The new data source I put "Role: test" and connect to the scorecard, but I get an error, as shown in the photo.
Previously had connected the new data source to "interactive grouping" and also appeared the same sign error. This may be because the columns of data sources, although representing the same variables do not have exactly the same name?
And one last question to not disturb more, the new data source would have to connect to the same "interactive grouping" model, or a new "interactive grouping" and that this is connected to the scorecard?
greatly appreciate your help
- Mark as Read
- Mark as New
- Bookmark
- Permalink
- Report Inappropriate Content
Nico,
Your variables need to have the same name.
If you set the role of the new data set as Test, you can connect it to the Interactive Grouping Node.
- Mark as Read
- Mark as New
- Bookmark
- Permalink
- Report Inappropriate Content
Miguel thanks for your help! Then I have to connect my new set of data to the same interactive grouping model? Do I have to add any other node?
- Mark as Read
- Mark as New
- Bookmark
- Permalink
- Report Inappropriate Content
Just connect your new data set to your Interactive Grouping node.
You won't see anything different on the results of your interactive grouping node, but you will see additional results on your Scorecard node. For instance, take a look at the Empirical Odds Plot.
To see the test set you can click on the ellipsis for Exported Data, then browse or explore the test set.
I hope it helps,
- Mark as Read
- Mark as New
- Bookmark
- Permalink
- Report Inappropriate Content
Thank you very much to both of you, it was very helpful to us. By connecting the new data source to the interactive grouping and running it, I an error shows up (in the photo), perhaps it is because some name differences between the two databases.
Now I'll try what you recommend maybe I will write again.
I thank you again
- Mark as Read
- Mark as New
- Bookmark
- Permalink
- Report Inappropriate Content
Miguel, the model was great! We could do what you told me. We would like to make one last question and thus not bother you anymore. At the time of selecting the observations to 1 or 0 by prediction probability, SAS uses as a cutoff 0.50. How I can change this value cutoff?
- Mark as Read
- Mark as New
- Bookmark
- Permalink
- Report Inappropriate Content
Hi Nico,
Glad to hear you have a good model!
What do you want to do exactly? Let's say you have a good scorecard, and then you used the Cutoff node to determine that 0.65 is a better cutoff than the defualt 0.5. What do you want to do next?
There are a couple alternatives depending what you want to do. You can add a Score node to your scorecard to grab the optimized code that you would put in production, and code the 0.65 cutoff before putting it in production.
If you want to use the new cutoff in Enterprise Miner for further analysis you will likely use a SAS code node.
Walk us through what you are up to and I will give you a couple ideas.
Thanks,
- Mark as Read
- Mark as New
- Bookmark
- Permalink
- Report Inappropriate Content
Hi Team,
I'm trying to figure out the target variable for PD Model(Behavior) and how its calculated(if I'm not wrong PD is caluculated as percentage and I'm not sure how its done). I know its Good/Bad variable for application scoring model. Should we also include Good/Bad variable and Percent variable as target varaibles in Behavior model? Sorry if it sounds basic!!
Thanks,
Srihari
- Mark as Read
- Mark as New
- Bookmark
- Permalink
- Report Inappropriate Content
Hi Srihari,
Bulding a Scorecard for behavior is not that different from building a Scorecard for origination (application).
You create a good/bad flag based on observed outcome. For example, you can build this flag based on 60 days past due on the first year of months in books.
I found this chart online from a class of retail finance at the Imperial College of London. I hope it helps!

Best,
M
- Mark as Read
- Mark as New
- Bookmark
- Permalink
- Report Inappropriate Content
Hi Miguel, Thanks for your clarification.
Cheers,
Srihari
- Mark as Read
- Mark as New
- Bookmark
- Permalink
- Report Inappropriate Content
Hi ,
In continuation to srihari's question, where n how could i see the probability of default value (lets say 0.6 %) for the customer used in the train values of model. And also for a new customer.
All i have reached is a scorecard window where in scores are displayed for each independent variable??
Thanks,
Anshul.
- Mark as Read
- Mark as New
- Bookmark
- Permalink
- Report Inappropriate Content
To see the probability of defaults for each customer, in the property panel for the Scorecard node, click on the ellipsis next to "Exported Data", then select the Train table and click on Browse... then all the way on the right, you should see your posterior probabilities.
When scoring new data, you should have a flow like the one pictured in the attached screenshot, then you can do the same thing from the Score node for the Score data set.

- Mark as Read
- Mark as New
- Bookmark
- Permalink
- Report Inappropriate Content
Hi,
Thanks for your reply, I can see scorecard_bin in the extreme right, posterior probabilities column is not displayed in my window. Do i need to make some changes in properties panel for this??
Thanks,
Anshul.
- Mark as Read
- Mark as New
- Bookmark
- Permalink
- Report Inappropriate Content
Sorry, you're correct - they aren't all the way at the right, but before the SCORECARD_POINTS column (after all the inputs, and grouped and WOE variables).
- Mark as Read
- Mark as New
- Bookmark
- Permalink
- Report Inappropriate Content
Similarly, when I do the same thing in score node, I can see Probability for level 1 of default and probability of classification columns. Can these be used to identify the PD (if yes, which one should be correct PD)??
Thanks,
Anshul.
- Mark as Read
- Mark as New
- Bookmark
- Permalink
- Report Inappropriate Content
Hi WendyCizka,
Thanks you very much, I could now see Residual Default 0 & 1 and similarly Predicted 0 & 1. Do not know the significance of these. Can you help here please??
Thanks,
Anshul.
- Mark as Read
- Mark as New
- Bookmark
- Permalink
- Report Inappropriate Content
So 0 and 1 are the levels of your target variable, and typically (and by default), 1 corresponds to a customer defaulting on a loan, and 0 is a customer who has not defaulted. You can change this by changing the Order for your target variable in the Input Data node - setting that to Ascending will reverse the assignments and treat 0 as indicating a customer who has defaulted. So the predicted posterior for level 1 would be the predicted probability of default for that customer.
.jpg")
Catch up on SAS Innovate 2026
Nearly 200 sessions are now available on demand with the SAS Innovate Digital Pass.
Explore Now →SAS AI and Machine Learning Courses
The rapid growth of AI technologies is driving an AI skills gap and demand for AI talent. Ready to grow your AI literacy? SAS offers free ways to get started for beginners, business leaders, and analytics professionals of all skill levels. Your future self will thank you.
- Find more articles tagged with:
- credit_scoring
- enterprise_miner
- scorecard
- tips&tricks
