BookmarkSubscribeRSS Feed

Tip: How to Select the Optimal Targets in Direct Marketing Using SAS® EM™ Incremental Response node

Started ‎09-10-2014 by
Modified ‎12-18-2015 by
Views 2,892

A successful direct marketing campaign can maximize the return on investment by motivating more customers to respond to a certain marketing action. To achieve the goal, it is necessary to analyze the marketing database carefully at the preparatory stage and select the optimal targets that are expected to generate incremental revenue.


The Incremental Response (IR) node in SAS® Enterprise Miner™ models the incremental impact of a campaign in order to optimize customer targeting for maximum return on investment. One response variable is required as the binary target variable for determining the likelihood that a customer responds to the campaign; the node also accepts one optional interval target which indicates the sales amount if the customer does respond. The node runs the incremental response model and subsequently the incremental outcome model when a secondary interval target is specified. In this tip, you will see one feature of the IR node which helps you select the optimal business targets based on the incremental revenue.


In the Results window of the IR node, there is a bar plot named as Average Incremental Revenue which is displayed along with more model diagnostics plots. The Average Incremental Revenue shows the expected incremental revenue averaged by decile. The expected revenue for each customer is calculated as


Expected Revenue (per response) = Expected Response Probability × Expected Sales – Cost.


Then for a given customer, the expected incremental revenue can be formulated as


Expected Incremental Revenue = Expected Revenue in Treatment - Expected Revenue in Control.


The Average Incremental Revenue plot provides important guidelines about which customers are considered as the optimal targets in terms of generating more incremental revenue that exceeds, or at least covers, the cost of campaign.


Let’s use the data set sampsio.dmretail and the flow as shown in Figure 1 to illustrate how to utilize the Average Incremental Revenue plot to select the optimal target.


fig1.png

Figure 1: EM flow running Incremental Response Node on DMRETAIL data set


Variable SALES which indicates the sales amount of a customer if the customer respond to the marketing action is set as the secondary target variable as shown in Figure 2.  When a secondary interval target variable is specified, it will then be used to calculate the expected sales per response in the previous formula of expected revenue. Otherwise, you can also specify constant revenue for all the respondents through the node properties. In such case, the expected revenue for each customer is then calculated as


Expected Revenue (per response) = Expected Response Probability × Constant Revenue - Cost.


fig2.png

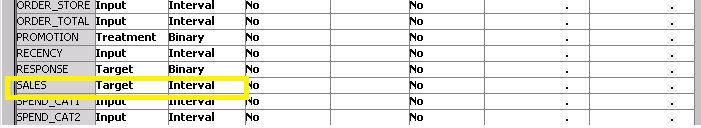
Figure 2: Variable list of DMRETAIL data set. Variable SALES is set as secondary interval target.


Figure 3 shows the key properties for the revenue calculation.


fig3.png

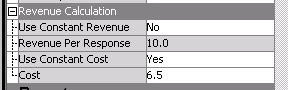
Figure 3: Properties for Revenue Calculation


The Average Incremental Revenue plot (Figure 4) clearly shows the cutoff between the 5th and 6th decile. The top bar plot is based on the analyses on Train data and the bottom one is from Validation data. To achieve the expected revenue higher or at least covering the campaign cost, only the customers in the top 5 decile should be targeted, and the results are consistent in this case for both Train and Validation data.


fig4.png

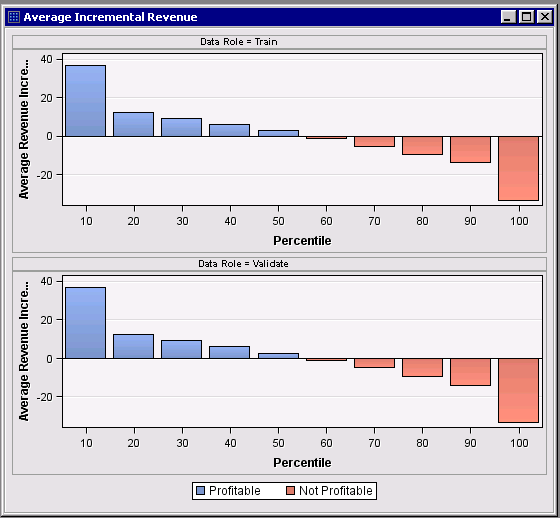
Figure 4: Average Incremental Revenue Plot of the Incremental Response Node


In summary, EM Incremental Response node offers various analyses besides the calculation of the average incremental revenue to identify the customers who generate incremental responses so as to maximize the net profit. For more details about the node, please refer to the paper “Incremental Response Modeling Using SAS® Enterprise Miner™”, SUGI proceedings, 2013.

Comments

This example is very good as introduction to this node.  I tried using this node following the paper but when I tried to valided the ranking using off-time sample, it didn't work any more.  In other words, when I used campaign data that is different from the campaign for model building, the result totally messed up.  The model is quite unstable.

Is there anythomg else that I can try to correct it?

Thanks.

Hi Eric,

There are many things that could affect the rank scoring in test data different from the training. Here are some possible strategies to improve the prediction. I am unable to narrow down one solution without digging deep into your data and the data generation.

As many people think, when doing an incremental response modeling study (or called net lift), one is really analyzing a designed experiment. In clinical trials, there are good practices that one can follow to run DOE, similarly, the purpose of controlling IR modeling is akin to matched pairs -- the random assignment of matched pairs to treatment and control so that the two groups have no difference in terms of other covariates (inputs) except the treatment effect. It is definitely worth your efforts to align treatment and control cases carefully with your campaign data for both train and test data sets. If you need more references about that, you can find many good SAS Global Forum papers out there talking about case control or matching cases.

Similar to the first point, you would need the train and test data be “identical” as much as possible by other inputs. For example, we were asked once by a customer, “what could be the time frame in order to measure a campaign efficiency, 3 months before and 3 months after?” There is no general rule, and always have some specific factors to be considered for each real case, like seasoning effects in a year, economic cycles, commercial product qualities, etc… Actually, these are the issues affecting other predictive modeling too. We would suggest you analyze the train and test data to see if one is best for mimicking the situation in another. It is also generally a good idea to run a pilot experiment prior to a real campaign to evaluate all those possible effects.

I would also suggest you try the variable selection based on Adjusted NIV, which adjusts the NIV with a penalty term. The penalty term describes the difference between net WOE calculated from training and from validation data. However, the previous two points are still the key so that you won’t have a big difference between the train and validation/test. Some other things that need to be handled for general predictive modeling, like missing value, data balancing etc., are on my list to check prior to run the IR node.

I hope this is helpful. Please feel free to let me know if you have further questions.

Thanks,

Ruiwen

Version history
Last update:
‎12-18-2015 03:45 PM
Updated by:

sas-innovate-2024.png

Don't miss out on SAS Innovate - Register now for the FREE Livestream!

Can't make it to Vegas? No problem! Watch our general sessions LIVE or on-demand starting April 17th. Hear from SAS execs, best-selling author Adam Grant, Hot Ones host Sean Evans, top tech journalist Kara Swisher, AI expert Cassie Kozyrkov, and the mind-blowing dance crew iLuminate! Plus, get access to over 20 breakout sessions.


Register now!

Free course: Data Literacy Essentials

Data Literacy is for all, even absolute beginners. Jump on board with this free e-learning  and boost your career prospects.

Get Started

Article Tags