Do you have data that you want to model with a textual component? In this tip, we look at how to create a predictive model with records that include textual data using nodes from the Text Mining tab in Enterprise Miner.
Example
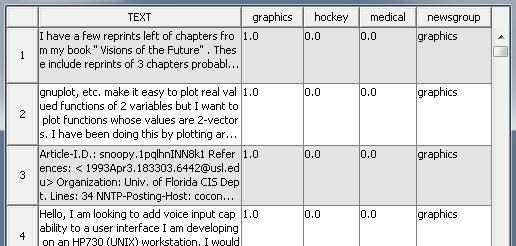
In this example, we use the SAMPSIO.NEWS data set (stored in the sample library). This data set contains 600 observations that are news articles, and the target we are trying to predict is the category of the news article. We should reject the binary variables graphics, hockey, and medical, as these are just indicators of our target.
The full diagram flow should look similar to the one below, though you are free to choose whichever modeling nodes you are most comfortable using. In this tip, we will discuss the first few nodes of the flow, and we will not address any general predictive modeling practices.
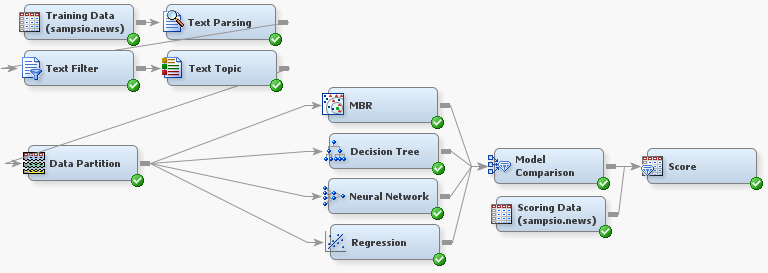
In order to process your text data, you must first use the Text Parsing and Text Filter nodes as seen in the diagram flow. The Text Parsing Node takes the raw text from the data source and has the ability to parse different languages and different parts of speech. The Text Filter Node needs to immediately follow the Text Parsing Node.
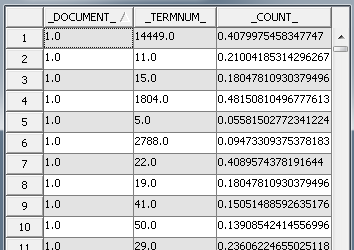
The Text Filter Node applies filters to your text data. You can define your own dictionary, term weighting, frequency weighting, and term filters, or you can use the defaults provided in Enterprise Miner. The Text Filter Node creates a new Transaction Data Set that details which observations contain which words. This is an example of sparse data (see Tip: Working with Sparse Data in SAS). A portion of the example data set is below.
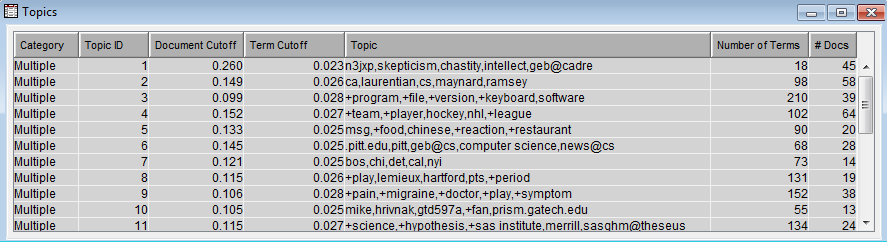
The Text Topic Node follows the Text Filter Node in the flow. The Text Topic Node uses the transaction data created by the Text Filter Node and creates “topics,” which are groups of words that are automatically determined to be related. In the results of the Text Topic Node there is a Topics table that contains a summary of information on each topic. Each topic is characterized by several key words, though the total number of terms in a topic is indicated in the Topics table. In the picture below you can see that Topic 3 is characterized by the keywords “program, file, version, keyboard, software,” but contains a total of 210 different words.
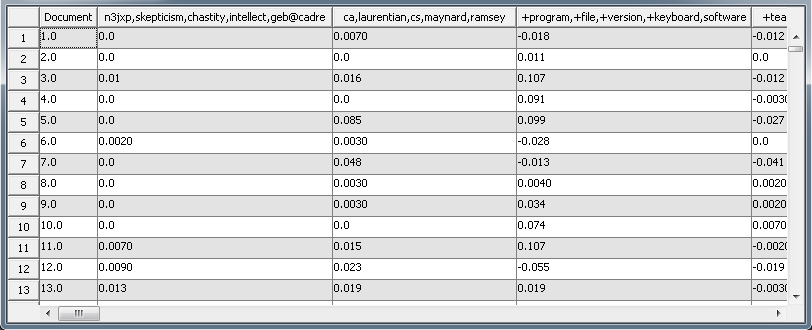
The Text Topic Node also adds new variables to the original training data. Each observation is assigned a weight of how much a given topic relates to the observation. You can see in the picture of the exported training table below that Document 1 has been assigned a value of 0.0070 for the topic “ca, laurentian, cs, maynard, ramsey.” In addition to the interval variables created, the Text Topic Node also creates binary variables indicating only if a topic is represented in the observation or not. However, for many standard predictive modeling tasks you will want to use the interval variables.
You can also look at the Level and Role of these new variables by looking at the properties of this exported table.
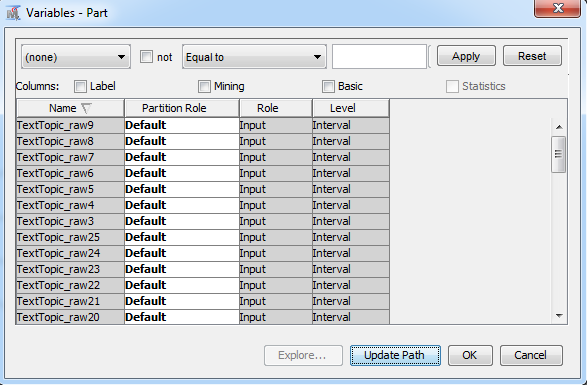
The new variables have the level of Interval and Role of Input. This allows us to use standard predictive modeling nodes to create a model for predicting newsgroup, the target. By creating the text topics, you are extracting the useful textual information and representing it numerically so that it can be used and understood by the standard predictive modeling nodes.
Now you’re ready to apply your predictive modeling knowledge to the exported training table from the Text Topic Node.
Conclusion
You are not limited to observations with text only, but you can also use the steps in this tip to use data with other types of inputs in addition to the textual data. You can download the XML attached to this tip, and import it through the File menu in Enterprise Miner (File->Import diagram from XML).
Happy Modeling!
.jpg")
