- Home
- /
- SAS Communities Library
- /
- Tip: How to Apply Path Analysis in SAS® Enterprise Miner™ to Gain Insi...
- RSS Feed
- Mark as New
- Mark as Read
- Bookmark
- Subscribe
- Printer Friendly Page
- Report Inappropriate Content
Tip: How to Apply Path Analysis in SAS® Enterprise Miner™ to Gain Insight into Sequential Behaviors
- Article History
- RSS Feed
- Mark as New
- Mark as Read
- Bookmark
- Subscribe
- Printer Friendly Page
- Report Inappropriate Content
Introduction
This tip introduces the Path Analysis node in SAS® Enterprise Miner™. I demonstrate how to use the node to summarize and gain insight into sequences of customer behaviors.
In a future tip, I’ll discuss how to build models with commonly occurring sequences that are derived using the Path Analysis node.
What is Path Analysis?
Path Analysis is an analytic technique used to identify sequential patterns in a history of events. The sequential patterns are called paths. Each path consists of one or more events coded by an ID and sequence number.
One source of sequential event data is web logs. Path Analysis can help you understand why users abandon their web session before making a purchase or help you improve a site by identifying unnecessary steps and obstacles faced by customers as they navigate the site.
Understanding paths can also lead to a more complete understanding of your customers and predict future outcomes. Common paths derived using Path Analysis can be used with along with other customer attributes to segment your customers or estimate the likelihood of a future event – like a purchase.
It's worth distinguishing Path Analysis in the data mining context from Path Analysis in Structural Equation Modeling. This tip pertains to the former (summarizing and gaining insight from users’ sequences of actions), not the latter (the analysis of directed dependencies among a set of variables).
Example
In this example we’ll use the Path Analysis node in SAS® Enterprise Miner™ to analyze the paths taken by customers as they navigate an e-commerce site.
Data
The data used in this example (“WebPath”) were obtained from the 2000 KDD Cup competition. They are real data.
The data are transactional. Each row contains a source page (referring file) and a target page (requested file) for particular customer session. The sequence of each request is identified using the session_sequence variable.
Here are the first few rows of data, which correspond to the first two user sessions recorded in the WebPath dataset:
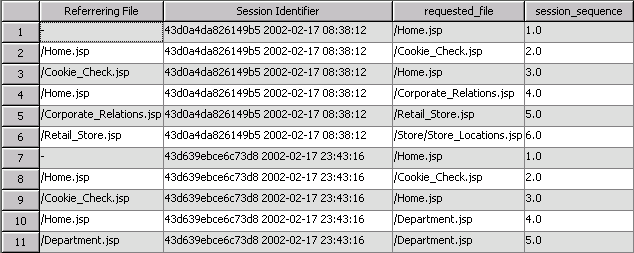
In the first session the website visitor accessed a total of 6 files, starting with Home and finishing at Store Locations. The second visitor accessed 5 files, starting at Home and finishing at Department. Neither customer made a purchase in their respective session. The dataset includes a total of 290 unique sessions.
Flow
To get started with path analysis, create a flow like the following in SAS® Enterprise Miner™:
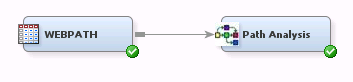
Steps:
1. Create a WebPath data source and drag it on to a diagram in SAS Enterprise Miner. The WebPath dataset is available in the SAMPSIO library.
2. Select the WebPath node and set its Train role to Transaction.
3. Define variable roles as follows:
|
Variable |
Role |
|
Requested_File |
Target |
|
SessionID |
ID |
|
Session_Sequence |
Sequence |
|
Referrer |
Referrer |
To use the Path Analysis node, your dataset must contain a target variable, a sequence variable, and at least one ID variable. The optional Referrer variable represents the source page – the page the user was on when they advanced to the next page in the path. The Referrer variable is used by the SAS Enterprise Miner Path Analysis node as part of its path completion algorithm to accurately match the website’s structure when visited pages are omitted from the web log.
4. Drag a Path Analysis node onto your diagram and connect it to the datasource node. The Path Analysis node is found in the Explore tab of the toolbar.
5. In node settings for the Path Analysis node, set the maximum number of items to 10. Also set the number of rules to keep to 50.
6. Choose Run.
When execution finishes, view node results.
Node Results
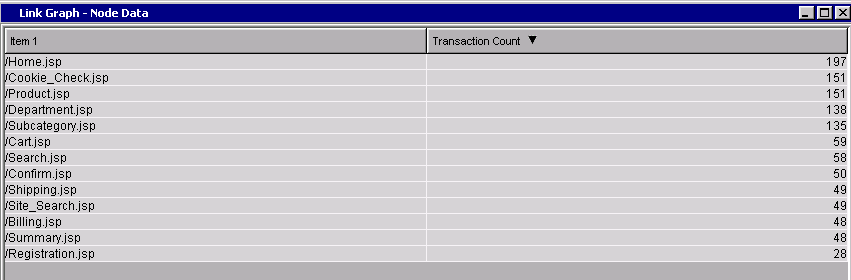
Items Report
Let’s start by reviewing some summary statistics. The Items Report in the Output window lists each of the unique items (files) found in the training set:
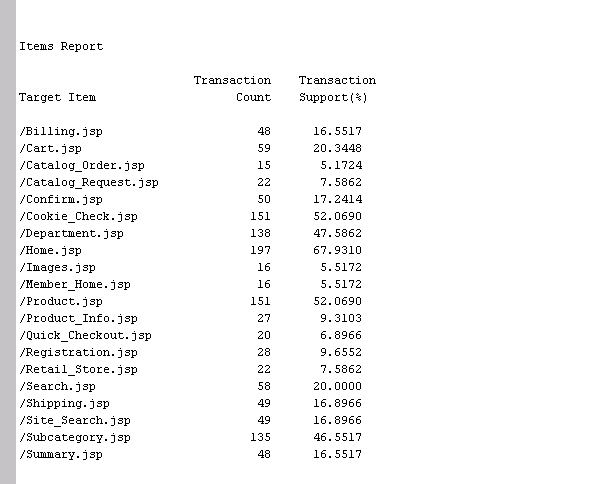
The Transaction Count column gives the hit frequency for each page. The page with the highest count is Home.jsp. The Home page is often the first page that a website visitor accesses.
The Support column tells you the percentage of views for each item relative to the total number of web sessions. The Home page was visited in about two thirds (67.93%) of all sessions. In contrast, Quick Checkout was only visited in 6.90% of the sessions.
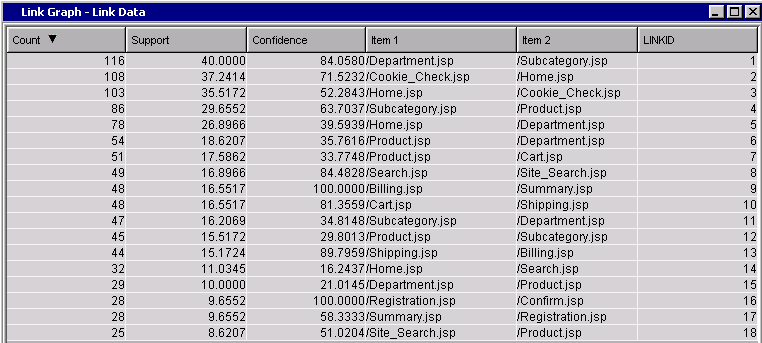
Link Graph
A link graph is a graphical representation of the connections between pages. To view the Link Graph, choose Rules > Link Graph from the View menu.
Interpretation
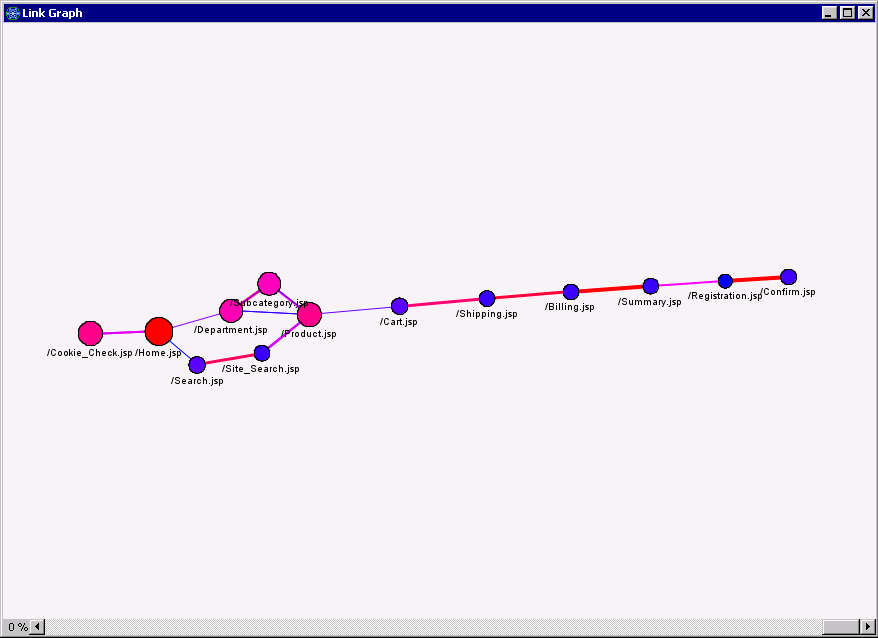
Here is the link graph for the WebPath data:
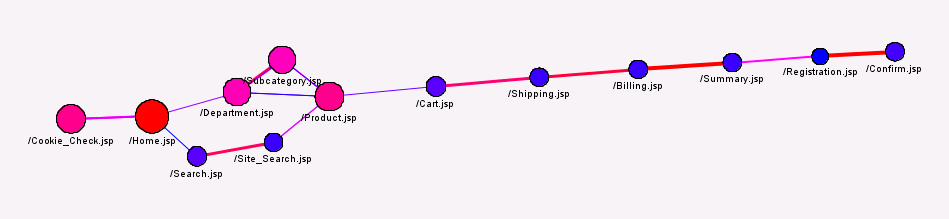
Each node in the graph represents a web page. Large circles mean higher counts (i.e., more visits).
Each link represents a connection between two pages. Thicker lines indicate higher confidence (the probability that a transaction contains page B, given that it contains the page A).
The link graph reflects a fairly typical navigation path through an e-Commerce site: The user navigates to the Home page where a cookie check is performed (this occurs under the covers). Then from the Home page the user either navigates directly to the product of interest or uses the Search facility to find the product. At that point the user may choose to add the product to their cart and follow the remaining steps to complete the purchase. The last steps are Registration and Confirmation.
By examining the size of the nodes in the graph, we see again that Home was the most visited item, followed by Cookie Check and the Product page. Registration was the least-visited page.
The strongest connections are between Billing->Summary and Registration->Confirmation. Summary and confirmation pages are typically shown automatically after the user completes the Billing and Registration steps, respectively. Among the weakest connections is the one between Product and Cart, indicating that there is a relatively low probability that a user who visits the Product page will visit the Cart page. There is also a rather weak link between the billing summary and registration pages, suggesting that few customers choose to register with the site after viewing a summary of their purchase.
Interactive Exploration
The link graph in this example is pretty simple, but if you have a complicated site it may help to simplify the graph. One of the interactive features in the link graph includes the ability to exclude low-confidence links and control the appearance of the graph.
To interactively filter links based on confidence, right click on the Link Graph and choose Graph Properties. This opens the Properties – Links dialog:
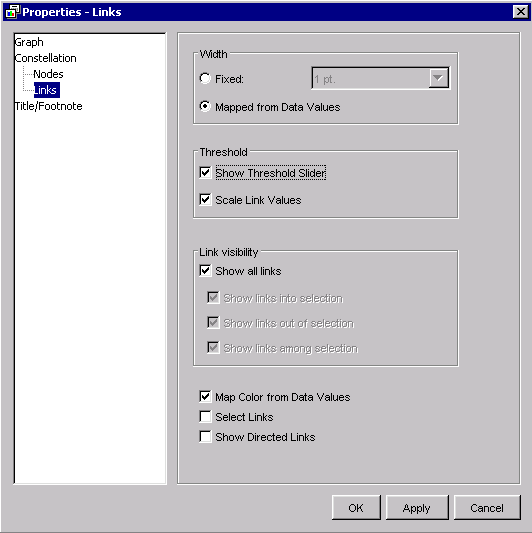
In the Links panel, choose Show Threshold Slider and press OK. A slider (scroll bar) appears at the bottom of the Link Graph window:
By default all links are shown, but you can filter out weaker links by dragging the slider to the left. Here, I’ve adjusted the slider so only links with confidence of 25% or greater are plotted:
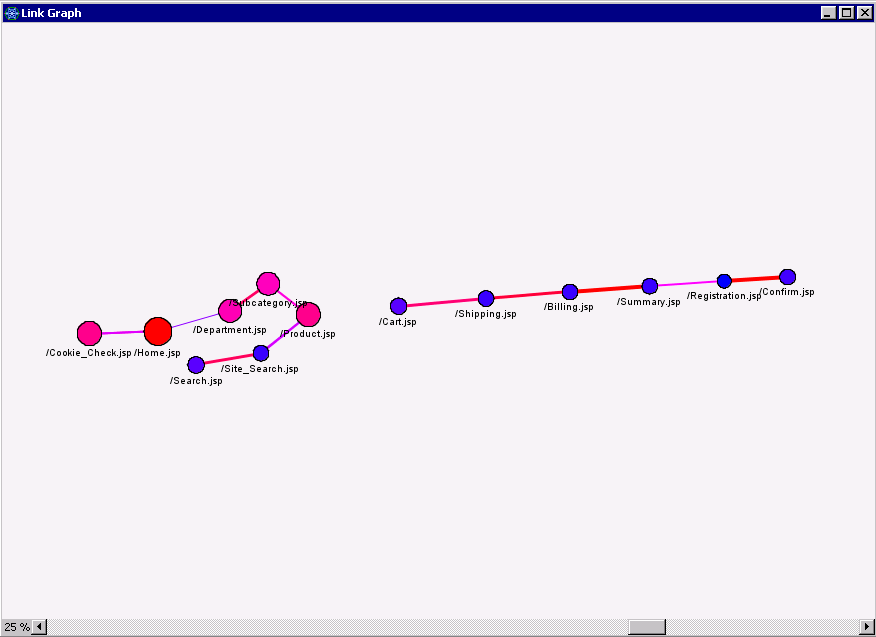
Notice that the Product -> Cart link drops out of the graph, confirming that customers who view a product tend not to take the next step to purchasing it.
You are probably wondering about the color of the nodes and links. By default, they are tied to node size and link strength. To simplify the graph, you can turn off color coding in Graph Properties:
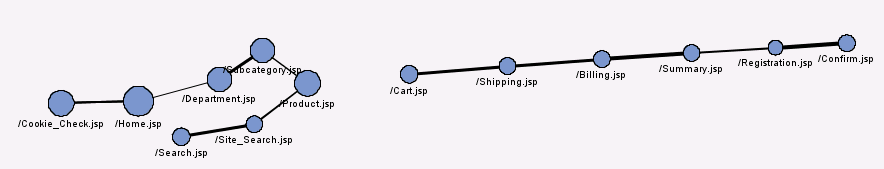
Now only node size and link width are tied to page frequencies and path strength.
Table Views
If you find it difficult to distinguish node sizes or link widths, you can access node and link statistics by clicking on the Table icon ( ) or choosing View>Table when the Link Graph has focus:
Node Data
Link Data
Rules
As you can imagine, not every visitor navigates from the Home page through purchase confirmation. The Rules table displays the most common subpaths (“rules”) taken by individual users within their respective sessions.
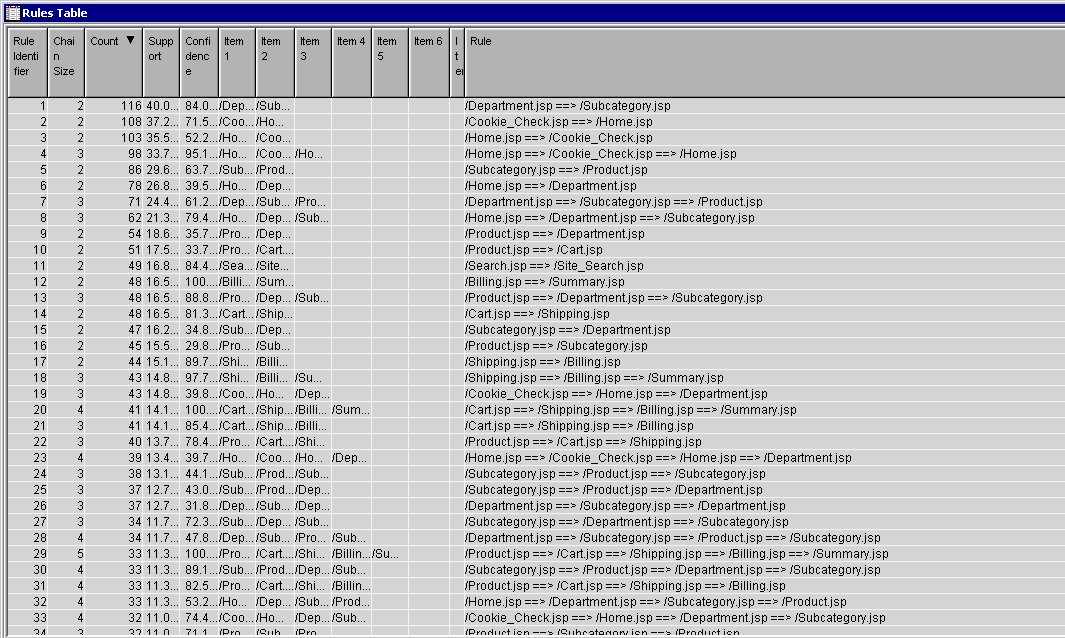
Each rule represents a commonly-occurring sequence among user sessions. Rules tend to be short relative to the full path from Home to Confirmation. One reason is that the rule construction algorithm tends to parse longer sessions into multiple (shorter) rules. In addition, the algorithm excludes uncommon (low support) rules by default, and longer, more complicated chains tend to be less common than shorter ones. You can adjust the Support threshold in node settings to reveal more or fewer rules.
The most common path is Department=>Subcategory, which occurred 116 times in the training set (in 40% of all sessions according to the Support column). This rule also had high confidence: when a visitor clicks /Department.jsp, there is an 84% chance that they will then click /Subcategory.jsp.
The next three most frequent paths involve cookie checks. Cookies are commonly used by web applications to persist information about a user or session state. But if cookie-related items merely clutter up your results, you can filter them out of your training data and re-run the analysis. In actual practice, iterative pruning of nuisance items is often necessary to arrive at a useful set of rules. You might also find it necessary to exclude items having to do with image files, style sheets, etc.
Rule #65 (not shown above) begins with selection of a product and ends at purchase confirmation:

This was not a common path, however. It occurred only 18 times in the training dataset with low support (occurring in 6.2% of all sessions).
You can use the Statistics plot along with the Rules table to interactively explore the rules:
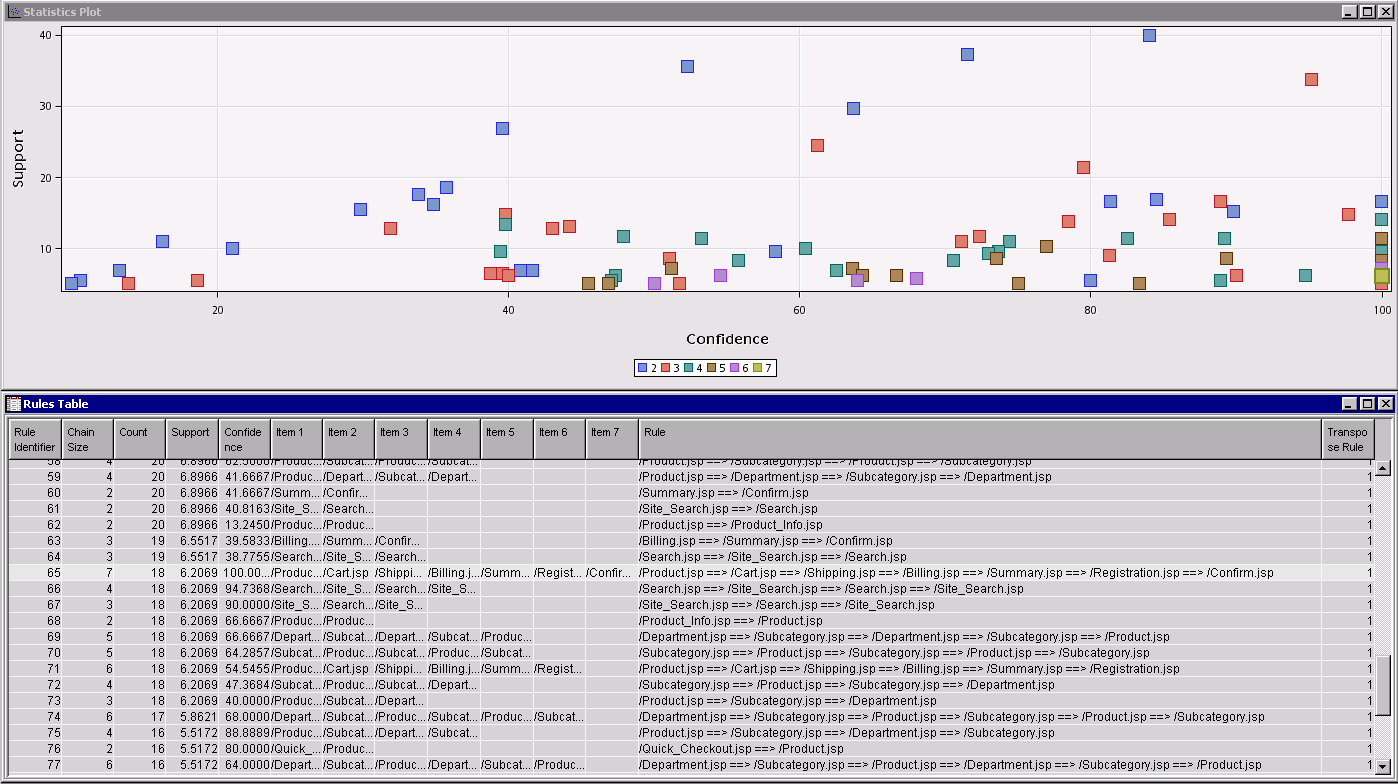
Each point marker in the Statistics Plot represents a rule, color coded by its length (2 to 7, in this example). When you select a marker, the rule is highlighted in the Rules table, and vice-versa. Information about the rule also appears in a tool tip when you position your mouse pointer over point marker in the plot.
Points in the upper right portion of the graph correspond to rules having relatively high confidence and support. Interestingly, rules in the lower right portion are often more interesting to data miners. These reliable but uncommon rules can indicate patterns that are not intuitively obvious and can potentially be exploited by a business.
Exporting Rule Indicator Variables
You can export a dataset that codes the occurrence of each rule (path) by user session for analysis using using successor node(s). To do so, choose the Export Rule by ID option in node settings and run the node.
To view the exported dataset, click the ellipsis (…) button in the Exported Data row in node settings. This opens a dialog showing datasets that are exported from the Path Analysis node:
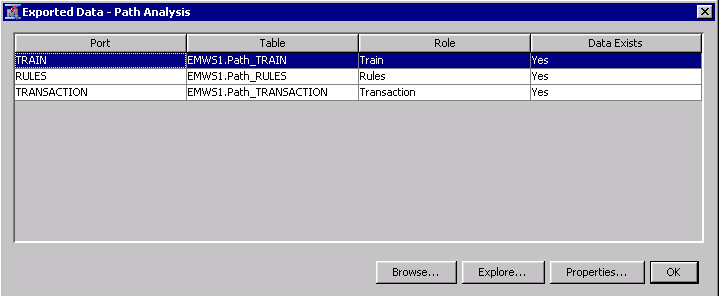
Select the TRAIN row (not RULES row, which corresponds to the Rules summary table we saw above) and choose Browse. This displays rule indicator variables for each session in the training dataset.
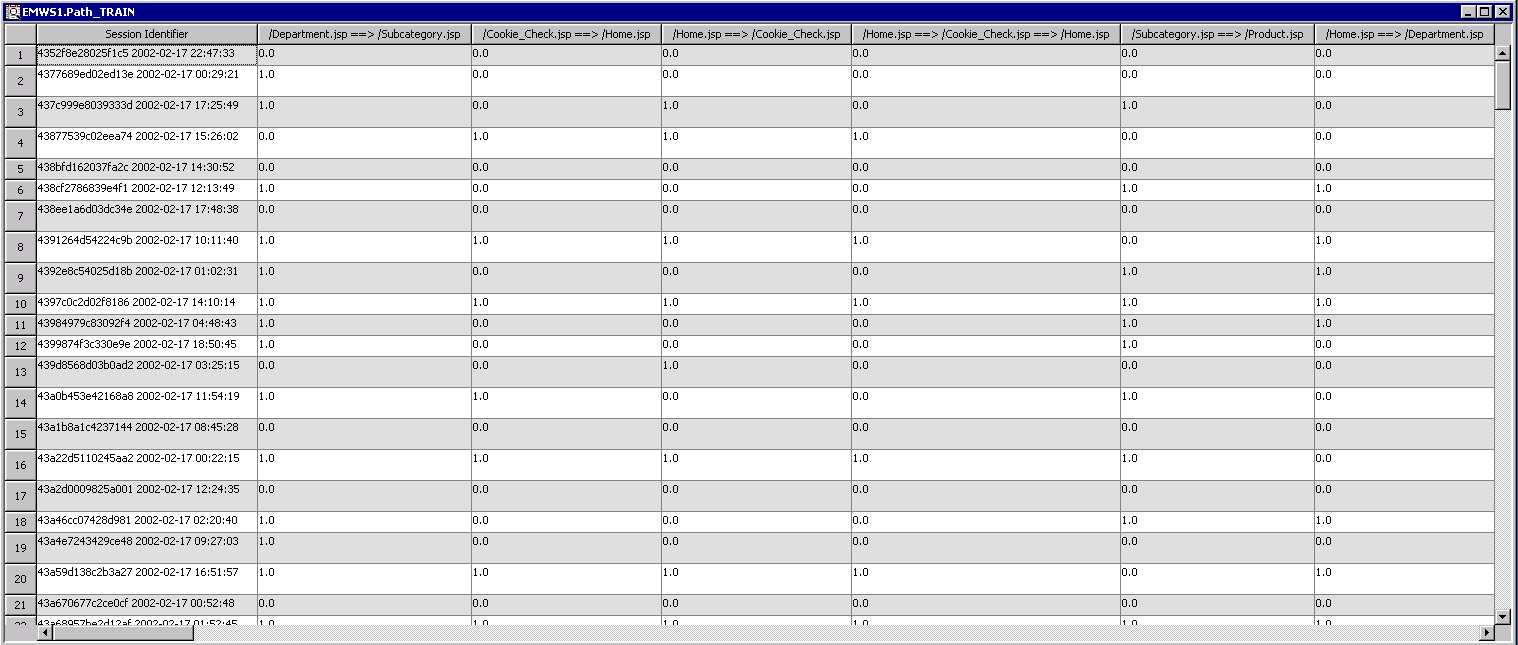
Each row in the table represents a unique session. The columns correspond to derived rules. Each cell is dummy coded to indicate whether each path occurred in a particular user session. A value of 1 indicates that a rule occurred within a particular session; 0 indicates otherwise. Note that multiple paths can occur in a single user session (and this is in fact very common).
Now that we have exported the rules, we could easily segment the sessions based on the indicator columns by connecting a cluster analysis node to the flow. Each of the rules columns is assigned a default a role of Input. You can also use exported rules in models to predict customer outcomes – although that would require merging a target and any additional model inputs to your rules dataset.
Summary
We used the Path Analysis node to summarize and visualize the paths taken by visitors through an e-Commerce site. In the process we uncovered some possible areas for improvement, in particular the conversion and site registration rates.
Of course you could go much deeper. For example, you might investigate factors that affect the likelihood that a user will add an item to their cart or make a purchase. Or even carry out experiments to see whether the timely incentives improve the likelihood that a customer completes a purchase or registers with the site. Fortunately, SAS® Enterprise Miner™ makes it easy to export rule indicator variables and use them as customer attributes in a segmentation analysis or predictive model. As mentioned, I will discuss how to build models using derived paths in a future tip.
In closing, I’ll point out Path Analysis isn’t only for web paths. For example, it could be used in Education to identify obstacles or sticky points that reduce students’ chances of obtaining a degree. Or to track customers paths through a department store or mall. Understanding the departments they visit and in which order may be a first step toward improving the customer experience or even increasing purchases. The Path Analysis node can be a useful tool whenever you need to identify sequential patterns in a transactional event history dataset.
References
- Path Analysis: Computing (Wikipedia)
- Path Analysis: Statistics (Wikipedia)
- Data Mining Techniques to Analyze a Library Database (Chakib Battioui)
Acknowledgement
This tip is based in part on an earlier presentation, Integrated Data Mining, by David Duling of SAS Advanced Analytics R&D.
.jpg")
Catch up on SAS Innovate 2026
Nearly 200 sessions are now available on demand with the SAS Innovate Digital Pass.
Explore Now →SAS AI and Machine Learning Courses
The rapid growth of AI technologies is driving an AI skills gap and demand for AI talent. Ready to grow your AI literacy? SAS offers free ways to get started for beginners, business leaders, and analytics professionals of all skill levels. Your future self will thank you.
- Find more articles tagged with:
- data_mining
- enterprise_miner
- node
- path_analysis
- tips&tricks
- web_analytics
