You’ve just designed a complex data management process in DataFlux Data Management Studio (a client application in all SAS Data Management offerings) for your organization. It has over a hundred nodes (data access or transformation logic), performs intricate data quality corrections on millions of rows in minutes and provides data to several key operational systems. Your project manager just told you that the process needs to handle twice the number of rows but finish in half the time using the same hardware. You consider the consequences of jumping on the first bus to Cleveland, never to be heard from again.
But don’t buy that ticket just yet. A close inspection of the design of the data management process may lead you to places in the data workflow where logic can be optimized, transformations reworked, and redundant analysis removed. The trick is understanding where the potentially underperforming nodes are located in your large data management process. Standard Data Management Platform logs provide a wealth of information but do not record how long a process is spending in each discrete node of the job. There is, however, a node profile log feature that once enabled delivers this type of information for both Data Management Studio and Data Management Server.
Node Profile Usage
The node profile log option generates detailed statistics logs for nodes in process and data jobs. As you run jobs or data services in the Data Management Platform environment, the log captures how much time is spent in operations for each node. It further breaks this down into segments for cumulative time spent processing rows, time spent preparing the node and time spent pre-executing logic for the node. These logs are extremely useful for finding performance bottlenecks in data management processes.
There are two node profile log options:
- Node Type: This log will record each node type used in the process along with how much time is spent on each of the three operations (prepare, pre-execute and execute) for all the nodes of this type, collectively. It also records a count of how many times each node is entered. This count generally corresponds to the number of rows entering each node.
- Node Instance: This log will record each individual node instance, what sub-job it is in, how much time is spent doing the same three operations (prepare, pre-execute and execute) for each, and a count of the total number of times each node was entered. The node instance identifier found in the log corresponds to an identifier shown for each node in a job when the node’s properties are opened for inspection in Data Management Studio.
Once your system is generating these logs, they become invaluable tools to help you pinpoint potential performance issues. Here are some of the things you can look for in the log data to locate trouble spots in your processes.
- Pre-execute node steps that take a long time, especially ODBC-type nodes. This could indicate a problem with establishing database connections in a timely manner.
- Execute node steps that take a lot longer relative to other nodes. Some processes are simply more intensive and will take longer. However, if similar node types vary widely in timings, it might indicate a misconfiguration in the node properties in the job itself.
- ODBC nodes with very long durations. These slow nodes may indicate long-running queries or commands that might need to be corrected in the database (by setting indexes for example, or recalculating database statistics).
- Long running joins, sorts and clustering steps. These problems sometimes indicate that node memory settings are misconfigured. These issues can be improved or resolved by increasing the amount of memory available to the nodes or by adjusting the number of threads on which the process runs.
Enabling Node Profile Logging
To turn on node profile logging functionality, edit the appropriate Data Management Server or Studio configuration file (service.cfg, batch.cfg, or app.cfg) by adding the following:
STEPENG/PROFILEBYNODE=true
STEPENG/PROFILEBYTYPE=true
You’ll also need to add the code shown below to the log file format XML file to make sure the data is logged in the correct output file. Refer to Data Management Platform documentation to verify the correct XML file (it will correspond to the configuration file described in the previous paragraph – service.log.xml, batch.log.xml, or dfwfproc.log.xml). The details of the appender can be altered to meet your needs. Both logging options will write to the log under the DF.RTProfiler heading at trace level.
To turn this logging on for Data Management Studio for example, add one or both of the PROFILEBYNODE and PROFILEBYTYPE options to your app.cfg file and add the following XML to your dfwfproc.log.xml file:
<appender class="RollingFileAppender" name="ProfFile">
<param name="Append" value="false"/>
<param name="ImmediateFlush" value="true"/>
<rollingPolicy class="TimeBasedRollingPolicy">
<param name="fileNamePattern"
value="%S{OSENV.APPDATA}/DataFlux/DMStudio/studio1 profiler_job_%d_%S{pid}.log"/>
</rollingPolicy>
<layout>
<param name="ConversionPattern" value="%m"/>
</layout>
</appender>
<logger name="DF.RTProfiler">
<level value="Trace"/>
<appender-ref ref="ProfFile"/>
</logger>
Upon restarting Data Management Studio and after running a process, this will create a “profiler_job_[datetime stamp].log” file in the “C:\Users\[user]\AppData\Roaming\DataFlux\DMStudio\studio1” directory, which is the default logging directory for Data Management Studio.
Note that on Windows computers, use of node profile logging will disable correct functioning of process jobs that use parallel processing. Under these circumstance, you may see that where you expected two or more active threads to be running simultaneously, only one appears to be utilized. Be sure to disable this logging option for production environments.
Node Profile Log Output
For the Node Type log option, the output will be comma delimited and the columns are as follows:
- Operation: can be either NX (cumulative time spent processing rows), PR (time spent preparing), or PX (time spent pre-executing)
- Node type: the type of access or transformation node
- Time: elapsed time in milliseconds
- Entries: number of times data entered the node
For the Node Instance log option the output will be comma delimited and the columns are as follows:
- Operation: can be either NX (cumulative time spent processing rows), PR (time spent preparing), or PX (time spent pre-executing)
- Filename: the job or sub-job filename
- Node instance: the identifier of that node in the job that was executed
- Time: elapsed time in milliseconds
- Entries: number of times data entered the node
Here is an example of the Node Type profile log with column headers added for clarity:
OPERATION, NODE TYPE, TIME, ENTRIES
NX,SOURCE_ODBC,92,3277
PR,SOURCE_ODBC,14,1
PX,SOURCE_ODBC,1,1
Here is an example of the Node Instance profile log with column headers added for clarity:
OPERATION, FILENAME, NODE INSTANCE, TIME, ENTRIES
NX,LogJob.ddf,1,93,3277
PR,LogJob.ddf,1,14,1
PX,LogJob.ddf,1,1,1
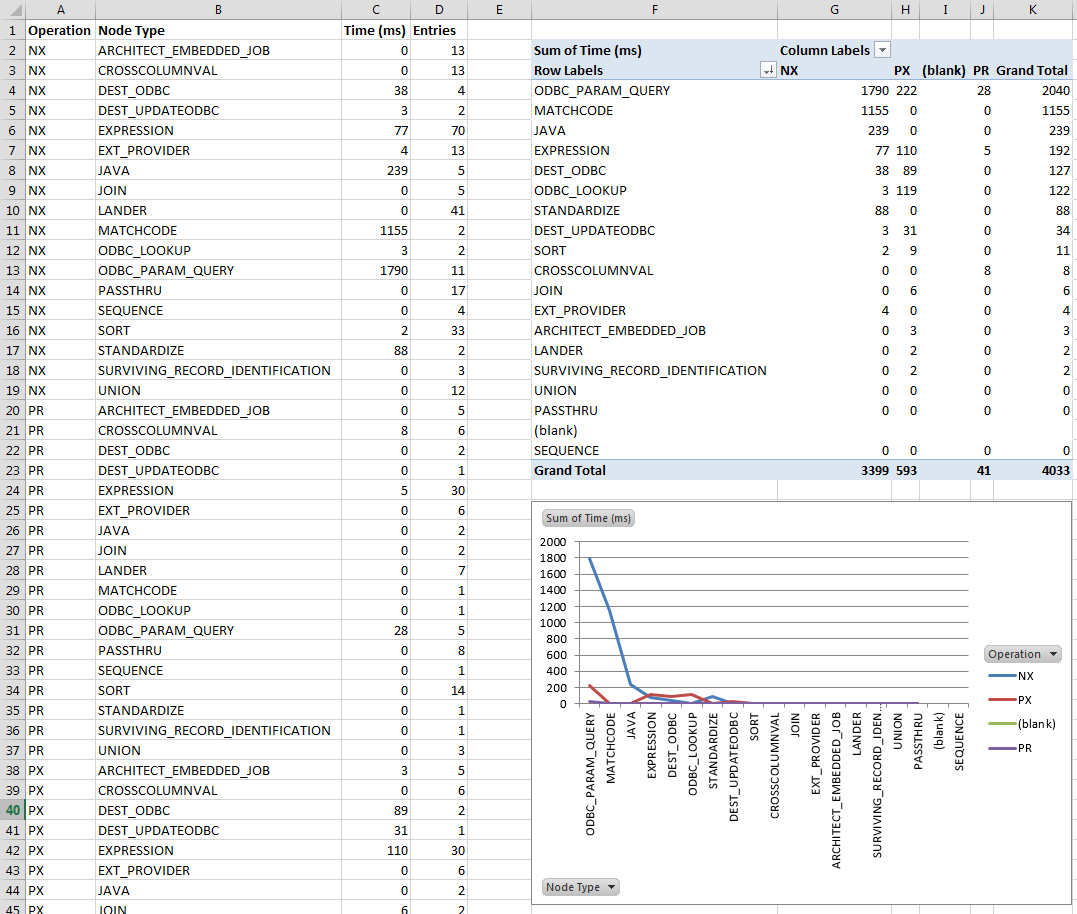
The format of a node profile log lends itself to further analysis in your favorite spreadsheet or reporting application. Here we see the details of a node type profile log on the left with a pivot table and chart on the right linked to the data table on the left. The pivot table combines timings on modes of operation for each node to give a full picture of the time spent in each node type. The chart is linked to the pivot table and gives a graphical representation of the log data, allowing you to quickly see what types of nodes account for the bulk of the processing time in the associated job. In this example, it looks like someone needs to tune a database query judging by the time spent in parameterized query (ODBC_PARAM_QUERY) nodes.
Don’t Get Detoured
Getting the most out of your data management processes is a must. Enabling node profile logging makes it much easier to work through the steps of locating and correcting underperforming areas of your data management jobs. With some deft analysis and corrective rework of your data management process, you’ll notice a substantial increase in job performance. With improved processes, you’re well on your way to earning a much-deserved vacation to sunny Miami courtesy of the same manager whose project you just rescued.

