- Home
- /
- SAS Communities Library
- /
- SAS Studio Custom Task Tuesday: Point Estimate Calculator
- RSS Feed
- Mark as New
- Mark as Read
- Bookmark
- Subscribe
- Printer Friendly Page
- Report Inappropriate Content
SAS Studio Custom Task Tuesday: Point Estimate Calculator
- Article History
- RSS Feed
- Mark as New
- Mark as Read
- Bookmark
- Subscribe
- Printer Friendly Page
- Report Inappropriate Content
This week's task will create row level Point Estimates for the user's dataset. The user can select any summary statistics they want to be included, and those will be combined back in with the row level data of the original data set.
This is helpful for being able to quickly compare each observational value to the mean for a given variable while looking at the data set. There are also many other applications where this kind of data structure would be beneficial.
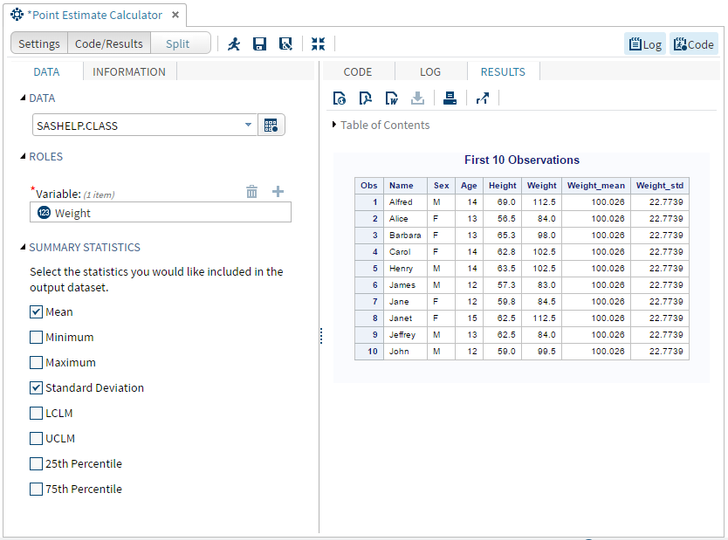
Below is what the finished product of the Point Estimate task will look like, along with sample output.
Want to try it yourself?
Get the code from the zip file at the end of this article or from GitHub.
Step 1: Getting Started
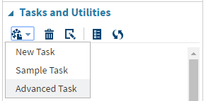
In SAS Studio, under the Task and Utilities section, open a “New Task” as well as the “Sample Task.” We will copy and paste the necessary Velocity Template code from the Sample Task to our task.
Step 2: Naming and Saving the Point Estimate Calculator Task
Name: Point Estimate Calculator
Description: Calculates point estimates and insert back in to the original dataset.
At the top of the VTL code for your New Task, you will need to fill in the Name and Description portions as shown below:
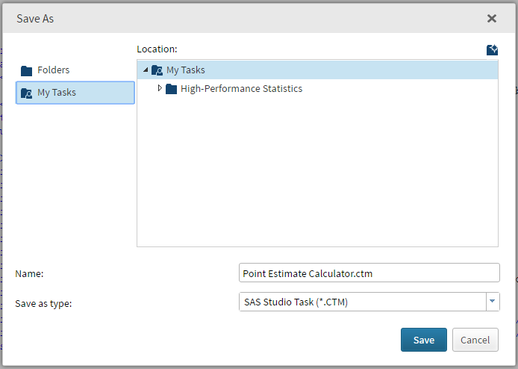
After you’ve done that, you should save this task to your My Tasks folder, so you don’t lose it. Click the
Step 3: Creating the Metadata Portion of the Point Estimate Calculator Task
Just like in previous posts, we will steal code from the built-in Sample Task in SAS Studio to make our lives easier. For this task, we will need one dataset selector, one role selector, and one checkbox group with 8 checkboxes. Find the code for these controls in the Sample Task and copy and paste them into the new task you've just created.
Customize labels and values to match what we want the Point Estimate task to look like. This is what the finished metadata section will look like:
<Metadata>
    <DataSources>
        <DataSource name="DATASOURCE">
	    <Roles>
	        <Role maxVars="1" minVars="1" name="VAR" order="true" type="N">Variable:</Role>
	    </Roles>
	</DataSource>
    </DataSources>
    <Options>
	<Option inputType="string" name="DATATAB">DATA</Option>
	<Option inputType="string" name="DATAGROUP">DATA</Option>
	<Option inputType="string" name="ROLESGROUP">ROLES</Option>
	<Option inputType="string" name="GROUPCHECK">SUMMARY STATISTICS</Option>
	<Option inputType="string" name="labelCHECK">Select the statistics you would like included in the output dataset.</Option>
	<Option defaultValue="0" inputType="checkbox" name="chkMEAN">Mean</Option>
	<Option defaultValue="0" inputType="checkbox" name="chkMIN">Minimum</Option>
	<Option defaultValue="0" inputType="checkbox" name="chkMAX">Maximum</Option>
	<Option defaultValue="0" inputType="checkbox" name="chkSTD">Standard Deviation</Option>
	<Option defaultValue="0" inputType="checkbox" name="chkLCLM">LCLM</Option>
	<Option defaultValue="0" inputType="checkbox" name="chkUCLM">UCLM</Option>
	<Option defaultValue="0" inputType="checkbox" name="chkP25">25th Percentile</Option>
	<Option defaultValue="0" inputType="checkbox" name="chkP75">75th Percentile</Option>
    </Options>
</Metadata>
Step 4: Creating the UI Portion of the Point Estimate Calculator Task
For every control in the metadata portion, there will be a corresponding line of code in the UI portion. In the metadata portion order of the controls doesn't matter, but the UI portion is where you tell velocity where each item goes in your task.
Copy and paste the corresponding UI code from the sample task into your task. Customize the object names to match what you did in the metadata portion. The UI portion should look like this when you are finished:
<UI>
    <Container option="DATATAB">
	<Group open="true" option="DATAGROUP">
            <DataItem data="DATASOURCE"/>
	</Group>
	<Group open="true" option="ROLESGROUP">
            <RoleItem role="VAR"/>
	</Group>
	<Group open="true" option="GROUPCHECK">
	    <OptionItem option="labelCHECK"/>
	    <OptionItem option="chkMEAN"/>
	    <OptionItem option="chkMIN"/>
	    <OptionItem option="chkMAX"/>
    	    <OptionItem option="chkSTD"/>
	    <OptionItem option="chkLCLM"/>
	    <OptionItem option="chkUCLM"/>
	    <OptionItem option="chkP25"/>
	    <OptionItem option="chkP75"/>
	</Group>
    </Container>
</UI>
Step 5: Creating the Code Template Portion of the Point Estimate Calculator Task
In your SAS code, you will reference the Velocity macro variables that we created above ($DATASOURCE, $VAR, $chkMEAN, etc). This is how you make the interface work with and control your SAS code, so this is the most important part. This SAS code outputs a dataset from proc means, and then merges it back in with the original dataset.
data copy;
	set $DATASOURCE;
run;

#foreach ( $item in $VAR )
	%let item = $item;
proc means data = copy noprint;
	var  $item;
	output out = means (drop = _TYPE_ _FREQ_)
	#if ($chkMEAN == 1)		mean   = &item._mean	#end
	#if ($chkMIN == 1)		min    = &item._min   	#end
	#if ($chkMAX == 1)		max    = &item._max   	#end
	#if ($chkSTD == 1)		std    = &item._std   	#end
	#if ($chkLCLM == 1)		LCLM   = &item._LCLM  	#end
	#if ($chkUCLM == 1)		UCLM   = &item._UCLM  	#end
	#if ($chkP25 == 1)		p25    = &item._p25  	#end
	#if ($chkP75 == 1)		p75    = &item._p75 	#end
;
run;
#end

data point;
    set copy;
    if _n_= 1 then set means;
run;

title "First 10 Observations";
proc print data=point(obs=10);
run;

proc datasets lib=work noprint;
	delete copy means;
run;
Step 6: Run the Point Estimate Calculator Task
You’re finished! You created a custom user interface to insert summary statistics into row-level data of a data set. Click the 


- Mark as Read
- Mark as New
- Bookmark
- Permalink
- Report Inappropriate Content
Many thanks for this - Custom Task Tuesday is a great series!
- Mark as Read
- Mark as New
- Bookmark
- Permalink
- Report Inappropriate Content
@ChrisBrooks Thank you so much for that awesome feedback! If you have ideas or suggestions for the series, let me know! 🙂
- Mark as Read
- Mark as New
- Bookmark
- Permalink
- Report Inappropriate Content
Thanks Olivia - one thing I mean to do with this Task is amend it to allow the optional use of BY groups so you could push multiple series through it in one run. I haven't had time to get to it yet but hopefully I will at some point!
- Mark as Read
- Mark as New
- Bookmark
- Permalink
- Report Inappropriate Content
@ChrisBrooks you read my mind! I just posted the next article in the series which is a post on improvements to this task! You can view that post here. I started to add in functionality to accommodate a by variable but it turned out to be a little bit more complicated than I thought. However, the improved task in the post allows you to select two variables to analyze and also allows you to specify a where clause so you can subset the data. I'll continue working on adding in the by variable! 🙂
SAS AI and Machine Learning Courses
The rapid growth of AI technologies is driving an AI skills gap and demand for AI talent. Ready to grow your AI literacy? SAS offers free ways to get started for beginners, business leaders, and analytics professionals of all skill levels. Your future self will thank you.
- Find more articles tagged with:
- Custom Task Tuesday
- Tips & Tricks


