- Home
- /
- SAS Communities Library
- /
- Recap of Alerting in SAS Viya
- RSS Feed
- Mark as New
- Mark as Read
- Bookmark
- Subscribe
- Printer Friendly Page
- Report Inappropriate Content
Recap of Alerting in SAS Viya
- Article History
- RSS Feed
- Mark as New
- Mark as Read
- Bookmark
- Subscribe
- Printer Friendly Page
- Report Inappropriate Content
In today's fast-paced world of infrastructure management, monitoring and alerting systems play a vital role in ensuring the health and performance of applications and services. An earlier post introduced the alerting capabilities provided by Prometheus for SAS Viya, which help administrators identify anomalies and respond to incidents proactively. This refresher article provides a high-level recap of what is available out of the box, what it can help with, and covers the process of creating new, custom alerts to enhance real-time monitoring.
Alerting is the process of triggering actions when defined conditions are met. In a SAS Viya deployment (with SAS Viya Monitoring for Kubernetes deployed), those conditions are based on metric information collected by Prometheus (about health and performance of your SAS Viya deployment) or log data collected by OpenSearch.
Alerts can help administrators proactively detect and predict potential anomalies with the deployment and/or infrastructure. When a defined alert condition or threshold is met, Prometheus lets the companion Alertmanager module know. Alertmanager can send notifications to a variety of channels, as well as take other actions automatically when an alert is triggered (such as creating a JIRA or ServiceNow ticket, or even autoscaling up/down). It also provides a facility for managing the lifecycle of triggered alerts (for example, to supress alerts while they’re being investigated).
So what kind of conditions can trigger alerts? When Prometheus is deployed, it includes a heap of generally useful alerts for common conditions out-of-the-box. These include alerts for scenarios like pods stuck in a CrashLoopBackOff state, StatefulSets not matching the expected number of replicas, Persistent Volumes filling up, or elevated CPU throttling. But administrators can also supplement these with their own bespoke alerts.
Before we get to the "how", let’s look at the type of metric information available in Prometheus. This can be done by submitting PromQL (the native, SQL-based querying language) expressions in the Prometheus Expression Browser web application. Conveniently, the Expression Browser includes a metrics explorer and has auto-complete, so you can begin by just selecting a metric and viewing the data available, and then adjusting your expression to filter for what you’re interested in seeing (and alerting on).
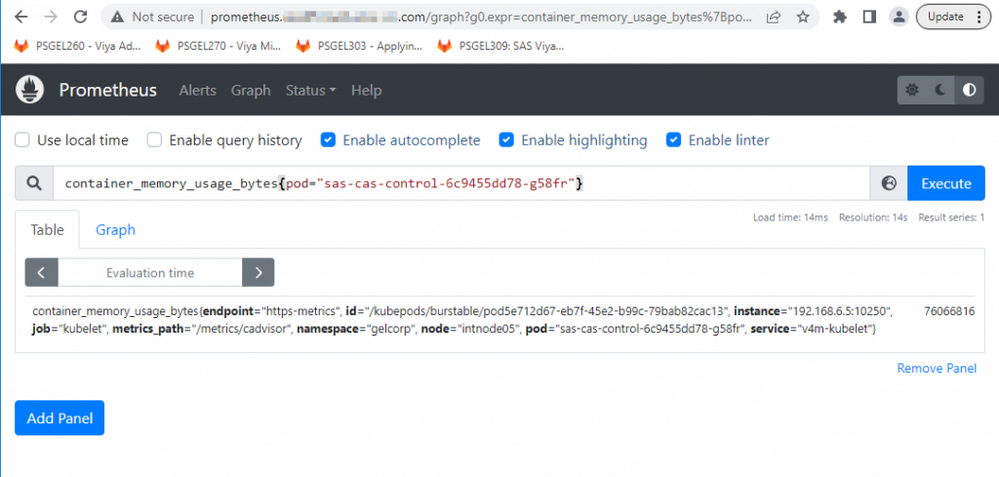
For example, assume we want to see memory usage for the sas-cas-control pod. If the word “memory” is typed into the query box, matching metrics are displayed and can be selected from the drop-down box. The container_memory_usage_bytes metric looks like a good match for our use case. A filter can be added by appending a curly brace to the query. We want to filter by pod, so when we start typing pod=", auto-complete again lets us click on the desired pod name from a drop-down list.
In this example, our resulting expression is container_memory_usage_bytes{pod="sas-cas-control-6c9455dd78-g58fr"}. If we hit the Execute button, we get the metric data values (in bytes) for the query.
Select any image to see a larger version.
Mobile users: To view the images, select the "Full" version at the bottom of the page.
Assume we want to create an alert for this metric. For instance, say we want an alert to be triggered when the sas-cas-control pod exceeds 80% of its memory limit, which we can find by running a kubectl describe on the pod (or for bonus points, try using the Expression Browser to find the appropriate metric and filters that will also give you the limit). Our expression would then become something like [memory usage] / [memory limit] as a percentage, which translates to PromQL as: (sum by (pod) (container_memory_usage_bytes{pod="sas-cas-control-6c9455dd78-g58fr"})) / (sum by (pod) (kube_pod_container_resource_limits{pod="sas-cas-control-6c9455dd78-g58fr",resource="memory"})) * 100
We can then add an operator to our expression to define the alert threshold - if we want to alert the trigger when the usage reaches 80% of the limit, the expression becomes: (sum by (pod) (container_memory_usage_bytes{pod="sas-cas-control-6c9455dd78-g58fr"})) / (sum by (pod) (kube_pod_container_resource_limits{pod="sas-cas-control-6c9455dd78-g58fr",resource="memory"})) * 100 > 80
The process for creating the alert is outlined in an earlier post, but to recap, requires a new YAML file which defines the alert in a PrometheusRule (custom resource) definition to be created and submitted with kubectl:
tee ~/PrometheusRule.yaml > /dev/null << EOF


apiVersion: monitoring.coreos.com/v1
kind: PrometheusRule
metadata:
  labels:
    prometheus: prometheus-v4m-prometheus-0
    role: alert-rules
  name: prometheus-viya-rules
  namespace: monitoring
spec:
  groups:
  - name: custom-viya-alerts
    rules:
    - alert: CASControlMemoryApproachingLimit
      annotations:
        description: sas-cas-control container memory usage is approaching its limit. This can result in OOM errors and CAS sessions closing unexpectedly.
        summary: CAS Control high memory usage
      expr: (sum by (pod) (container_memory_usage_bytes{pod="sas-cas-control-6c9455dd78-g58fr"})) /  (sum by (pod) (kube_pod_container_resource_limits{pod="sas-cas-control-6c9455dd78-g58fr",resource="memory"})) * 100 > 80
      labels:
        severity: critical
EOF


kubectl -n monitoring create --filename ./PrometheusRule.yaml
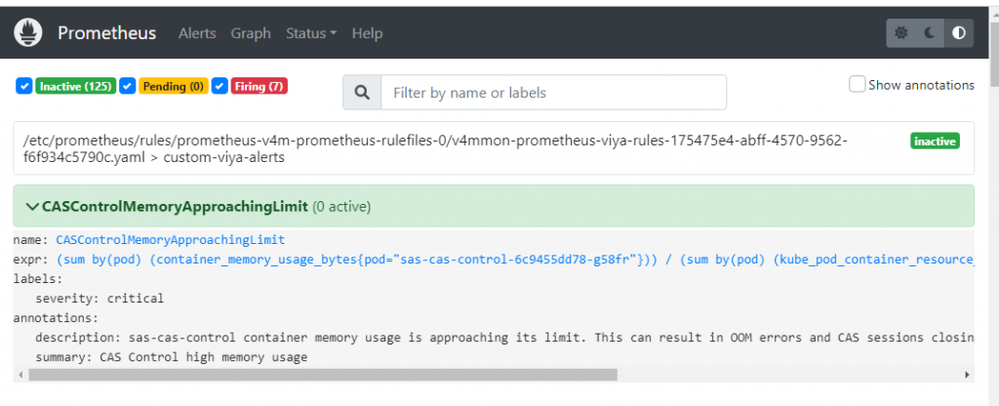
Once created, the alert will be visible in the Prometheus UI's Alerts page:
If it when it triggers, it will turn red, and will also appear in the separate Alertmanager UI. When alert conditions are addressed/remediated, the alerts automatically return to a state of “Inactive” (not firing) without any intervention from an administrator. Administrators can "silence" firing alerts in the Alertmanager UI as a way of acknowledging them while they are being investigated.
Obviously, admins still need to specify what happens when the alert does trigger – for example, deciding who gets notified and how. This requires modifying the Alertmanager configuration. A good starting point is this post on alert routing. There are several earlier articles which outline how to configure Alertmanager to integrate with various third-party applications such as MS Teams, and Slack. . The command-line based amtool can also be very useful here.
Leveraging the powerful and flexible alerting capabilities provided by Prometheus in SAS Viya can enable organizations to stay ahead of critical situations, respond promptly to incidents, and optimize their operational efficiency.
For additional information, refer to the official Prometheus documentation and the SAS documentation on SAS Viya’s logging and monitoring.
Catch up on SAS Innovate 2026
Dive into keynotes, announcements and breakthroughs on demand.
Explore Now →SAS AI and Machine Learning Courses
The rapid growth of AI technologies is driving an AI skills gap and demand for AI talent. Ready to grow your AI literacy? SAS offers free ways to get started for beginners, business leaders, and analytics professionals of all skill levels. Your future self will thank you.
- Find more articles tagged with:
- alerts
- DevOps
- GEL
- monitoring
- observability
- prometheus


