What is Clustering?
“Clustering is the process of dividing the datasets into groups, consisting of similar data-points”. Clustering is a type of unsupervised machine learning, which is used when you have unlabeled data.
Let’s understand in the real scenario,
Group of diners sitting in a restaurant. Let’s say two tables in the restaurant called T1 and T2. People in Table T1 might be related to each other, or maybe a group of family members or colleagues or anything.
In a similar way, people in table T2 might be related to each other or maybe a group of colleagues or anything. But, when comparing people sitting in table T1 and people sitting in table T2, they are entirely different and not at all related to each other.

In a similar way, people in table T2 might be related to each other or maybe a group of colleagues or anything. But, when comparing people sitting in table T1 and people sitting in table T2, they are entirely different and not at all related to each other.
Clustering also works in the same way. Data points in one cluster are entirely different from data points in another cluster. All the points in the same cluster are either the same or related to each other.
Another good example is the Netflix movie recommendation.

Netflix recommends movies based on the history of the user’s watch. Whatever people watched; similar films related to it will be shown. Clustering algorithm generates all of these recommended lists.
Clustering can be used for segmentation and many other applications. It has different techniques. One of the most popular, simple and interesting algorithms is K -Means Clustering.
What is K-means Clustering?
K-Means is a clustering algorithm whose main goal is to group similar elements or data points into a cluster. “K” in K-means represents the number of clusters.
K-means clustering steps:

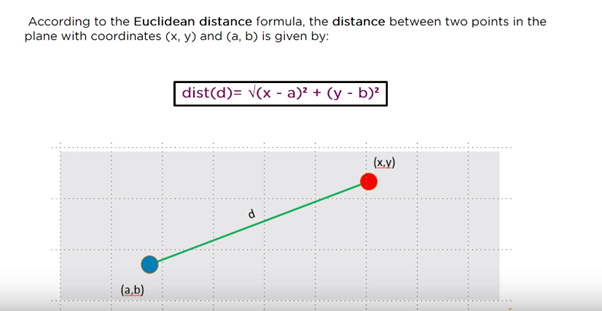
Distance measure will determine the similarity between two elements and it will influence the shape of the clusters. Normally, Euclidean distance will be used in K-Means Clustering
The Euclidean distance is the “ordinary” straight line. It is the distance between two points in Euclidean space.
How does K-Means Algorithm work?
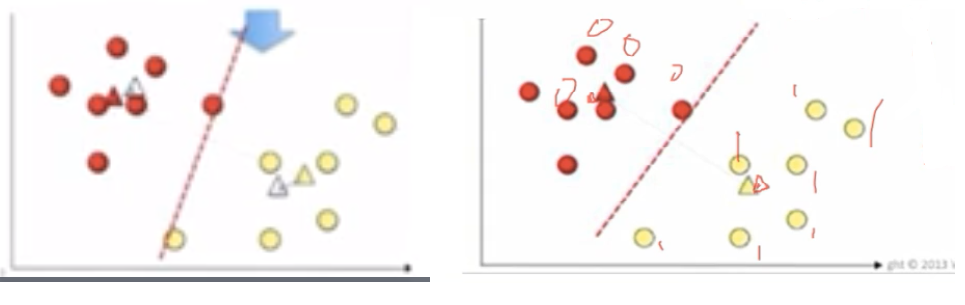
Let’s take two data points. Assume K =2. Then, it will take two random centroids anywhere in the data and based on that it will draw a line in the middle. One centroid represents in red and another one in yellow. Then all the data points towards the yellow centroid classified into yellow. All the data points towards the red centroid classified as a red. This is the first iteration step.
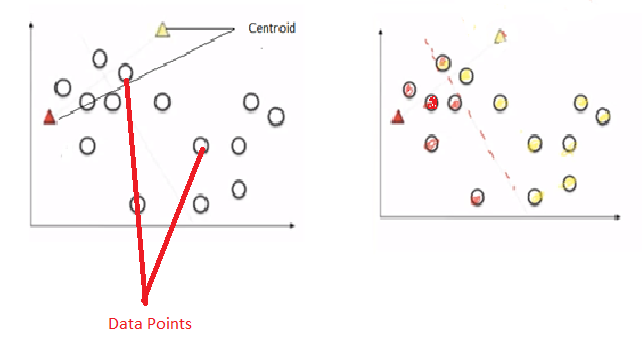

Next step, it calculates the distance from the centroid to data points by using the Euclidean method. And both red and yellow centroid points moves into new points by calculating the mean of all the points.
Again, it draws a new line between new centroid points. Automatically, all the points falling towards the red centroid will be recognized as a red group and yellow centroid will be recognized as a yellow group.
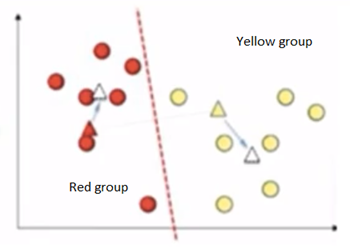
Again the same step will be repeated with new points and it will calculate new centroids. We can clearly see that data points has been moved to different groups.
It keeps on going until centroid movements become almost negligible. Then, it becomes cluster 1 and cluster 2. Here, the output Y label will give 0’s and 1’s. 0’s represent cluster 1 and 1 represent cluster 2. If it is three clusters, then it gives 0, 1 and 2.
Advantage:
1) Practically work well even some assumptions are broken.
2) Simple, easy to implement.
3) Easy to interpret the clustering results.
4) Fast and efficient in terms of computational cost.
Disadvantage:
1) Uniform effect often produces clusters with relatively uniform size even if the input data have different cluster size.
2) Different densities may work poorly with clusters.
3) Sensitive to outliers.
4) K value needs to be known before K-means clustering.
If you find any mistakes or improvement required, please feel free to comment.

