“There’s no ‘I’ in team,” my mother, coaches and teachers said to me growing up – as I’m sure yours did too. And they were right! A successful team plays well together, passes often and understands the power of working together.
In my old soccer days, I slit my eyes at “show boaters” on my team – those that took the ball solo through a few defenders and then were stopped just before scoring. Why didn’t she just pass it, let her teammates help?
This matrix, based on 2010 World Cup data, shows a strong relationship between passing and winning.
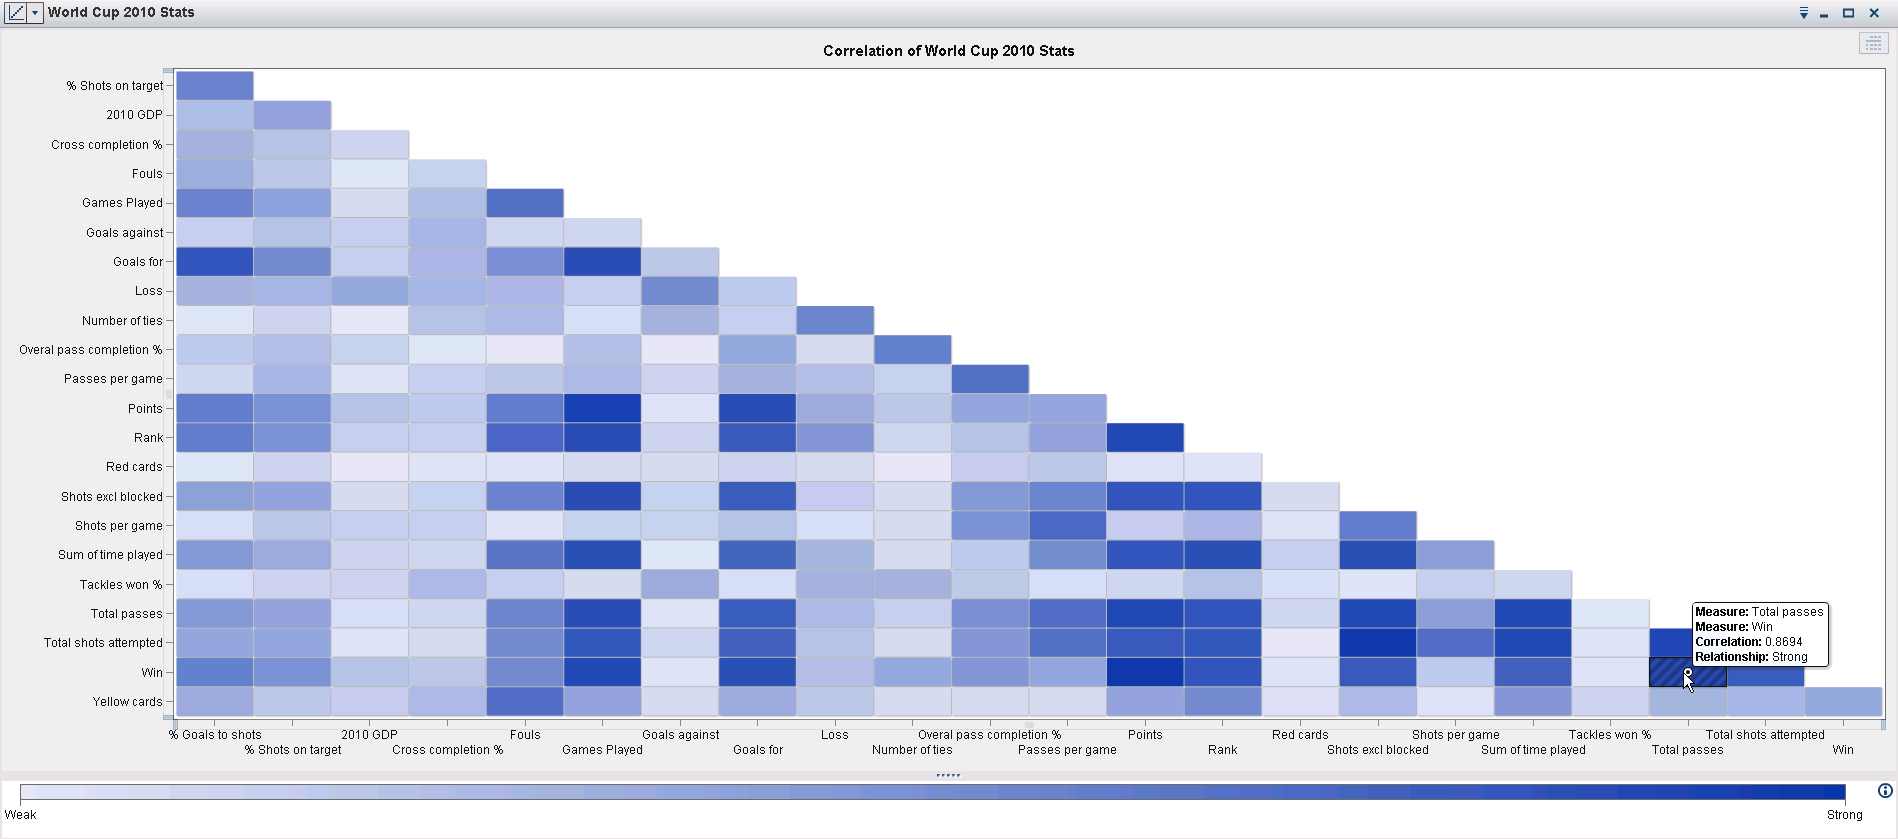
Quick tip: darker color = higher correlation. The World Cup data came from The Guardian and the GDP data came from the World Bank’s public site.
AllAnalytics Executive Editor Michael Steinhart points out teamwork in his commentary on the matrix:
I like the correlation between wins and "shots excluding blocked," which shows that the more shots you take, the higher your chances of success, and the correlation between wins, points scored, and total passes, which is a strong testament to the power of teamwork.
Can you attest to the value of working as a team in your professional or personal life? What other connections are worth noting from this graph? Keep following this community for other SAS Visual Analytics graphs on the World Cup.

