- Home
- /
- SAS Communities Library
- /
- How to Assess Messy Data: Step One - Data Review
- RSS Feed
- Mark as New
- Mark as Read
- Bookmark
- Subscribe
- Printer Friendly Page
- Report Inappropriate Content
How to Assess Messy Data: Step One - Data Review
- Article History
- RSS Feed
- Mark as New
- Mark as Read
- Bookmark
- Subscribe
- Printer Friendly Page
- Report Inappropriate Content
Editor's note: SAS programming concepts in this and other Free Data Friday articles remain useful, but SAS OnDemand for Academics has replaced SAS University Edition as a free e-learning option. Hit the orange button below to start your journey with SAS OnDemand for Academics:
I was having an interesting conversation with friends earlier this week and the topic of “data checks you should before you do anything else” came up. I thought it was an appropriate topic for this week’s Free Data Friday post. A well-done data review can save you a lot of frustration, project delays, and back-and-forth emails / phone calls.

I wanted to look at data that was “messy” – missing values, bad data, etc.; one outcome of the increased interest in Open Data is that organizations are now becoming more aware of their data and cleaning it before it is published.
After a lot of digging around (weather, sports, etc.) I found a dataset that met my requirements. It’s from the City of Edmonton Open Data Portal and is a listing of the city-owned trees.
Get Started with SAS OnDemand for Academics
Getting the data ready
The data was already in a format that I could use, as it was in standard CSV format.
The Results
The first thing I do is after importing the data (assuming no errors that indicated a review of the raw data was needed), I run PROC CONTENTS...
PROC CONTENTS DATA=WORK.IMPORT; RUN;
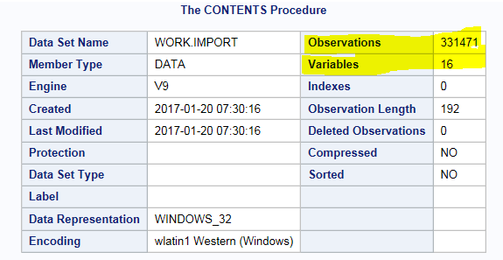
...which produces three tables, but I want to highlight two of them:
The first screen shot shows some rather boring information, but I’ve highlighted the key pieces. Knowing the number of observations lets me decide if, when doing my analyses and data review, if I want to limit my output to a smaller data set. For example, if I want to review the data that is missing Latitude or Longitude, I don’t necessarily need to see all the data – I am just looking for a pattern, and a sample of about 10% should give me that.
The second screenshot is the listing of the variables and their formats; this is something I put into Excel and have open as I’m writing my SAS code. Knowing this information is obviously important, and working with a datas
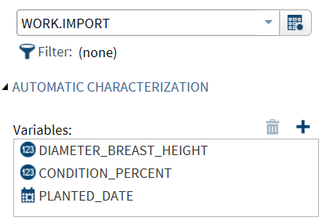
My next step is to typically run the Characterise Data task, specifically focussing on my Date and Numeric data; in this example, I’m only running the task on Diameter_Breast_Height, Condition_Percent, and Planted_Date:
:Nothing really interesting except when I scroll to the bottom, and see this:
I’m suspicious of the 1899 date (planting a tree in December in Edmonton? I really don’t think so!) and the 2105 date is clearly a typo. It’ll be up to you and the person requesting the analysis to decide how to handle these.
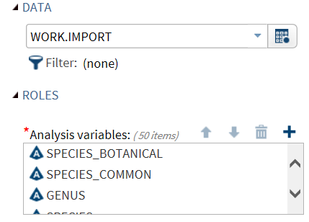
My next task is to look at the missing data; I’m only looking at Categorical Data for this example.
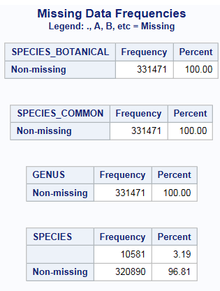
When I run the task I get this:
I have 3.2% of my SPECIES data missing; that may not be an issue, or if that’s the key variable, that may be enough to trigger a review of the data collection process.
I’ve decided in my review that I need more information on the SPECIES variable, so I’m going to go back to the Characterise Data task and run it specifically on this one column.
I’ve truncated the output to highlight the three SPECIES I wanted to focus on. For some reason, Cherry and Plum have brackets around them; that may be to have them sort to the top of the list, or for some reason. The more (potentially) concerning fact is that there are almost 21,000 trees whose species is listed as “X”. Combined with the missing data, that’s almost 10% of the total; even if this column is going to be a secondary part of your analysis, it should be investigated before you get too much further.
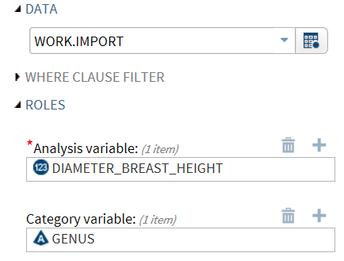
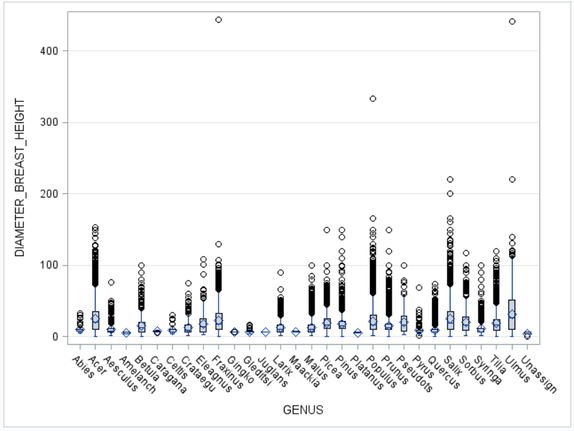
The last piece I wanted to show was a Box Plot; these are extremely handy as they show your Mean, Median, Average, and Interquartile Range all on a single output. I’m running my graph comparing the GENUS to the DIAMETER_BREAST_HEIGHT:
Here’s the output:
The first thing I see is that there are some clear outliers that I need to investigate; the diameter of >200cm seems to be a good benchmark overall, and there may be a couple of others I’d want to review (for example, the PICEA at 150cm seems to stick out). I’m also seeing that there are a number of “Unassigned” trees, and those should be pulled out of the data as well.
Context is everything
I should stress that this is not an absolute nor complete list; your data review will depend highly on what you're looking at. Missing data may be fine in genomic data, but not if you're doing housing-market analysis. "Unknown" may be appropriate if you're dealing with a catalogue of astronomical phenomenon, but not when dealing with diagnosis of a patient in healthcare data.
Finally, I’d like to recommend three fairly slim books that can set you up for success with your data analysis. I have a very strong 80/20 rule when it comes to data – I spend 80% of my time reviewing, exploring and understanding the data, so then I spend 20% of the time actually writing the code. These books all embrace that philosopy:
- Data Management for Researchers by Kristen Briney (non-SAS, but very good and covers a wide range of topics such as managing your files, storing / documenting code, etc).
- Data Analysis Plans: A Blueprint for Success Using SAS by Kathleen Joblanski and Mark Guagliardo
- A Recipe for Success Using SAS University Edition: How to Plan Your First Analytics Project by Sharon Jones
Now it’s your turn!
Did you find something else interesting in this data? Share in the comments. I’m glad to answer any questions.
- Mark as Read
- Mark as New
- Bookmark
- Permalink
- Report Inappropriate Content
I run the macro 'oto_voodoo' on any new data sent to me

see for more documentation
https://drive.google.com/file/d/0ByX2ii2B0Rq9Y003ZXZFT1pBV1U/view?usp=sharing


I run this on any new data sent to me

I don't think this will run under server EG, best with 'old text editor?'
Compute and memory intensive, runs ok on a power workstation

WHAT THE MACRO DOES

1.   Dataset level summary -- ie number of obs, variable types, static data

2.   Cardinality page  (primary keys, codes/decodes  number of unique
     values for every variable - EG often fails here)

3.   Complete frequency for all variables numeric and character with less
     than 200 levels

4.   For variables with over 200 levels top 100 most frequent and bottom
     100 least frequent
     Least frequent are the more interesting cases.

5.   Proc means on all numeric variables

6.   Proc univariate on all numeric variables

7.   Special datetime  analysis

9.   Histograms on all variables with less than 200 levels

10.  Proc contents

11.  Frequency of all numeric variables Missing, negative, zero and positive

12.  Duplicates on single or compound key. Output printed vertically for
     easy comparison

13.  Cross tabs of every variable with every other variable top 16 levels
     (if selectd)

14.  You can also select one variable to cross tab with all other variables
     max top 16 levels

16.  Maximum and minimum lengths to hold all numeric and character variables
     exactly (optimize)

17.  Correlation of all pairs of numeric variables sorted by largest
     correlation to lowest.

18.  Nice display of max and mins for numeric and character in one table

19.  List of identical columns ie date and date1 have equal values on all
     observations

19   One to Many, Many to One, One to Many and Many to Many

20   Cochran-Mantel-Haenszel Statistics

21   Finds missing patterns  (missing pattern frequncies)

22   Printout of first 20, middle 20 and last 20 observations.

23.  Correlation of all pairs of character variables (CMH)
     .

/* for easy editing here are the locations macros un oto_voodoo
prefix area helps
 %macro utlnopts           56
 %macro _vdo_macnam        93
 %macro utlfkil            109
 %macro nobs               158
 %macro nvar               199
 %macro _vdo_cdedec        274
 %macro _vv_annxtb         306
 %macro _vdo_basic         418
 %macro _vdo_optlen        3051
 %macro _vdo_getmaxmin     3144
 %macro _vdo_getmaxmin001  3169
 %macro _vdo_begmidend     3237
 %macro _vdo_clean         3331
 %macro _vdo_chartx        3402
 %macro _vdo_mispop        3606
 %macro _vdo_keyunq        3653
 %macro _vdo_dupcol        3734
 %macro _vdo_cor           3819
 %macro _vdo_mnymny        3882
 %macro _vdo_relhow        3897
 %macro _vdo_cmh           4020
 %macro _vdo_tabone        4116
 %macro _vdo_taball        4181
 %macro _vdo_unqtwo        4261
 %macro utl_getstm         4463
 %macro DirExist           4476
 %macro utlvdoc            4488
 %macro _vdo_unichr        4495
- Mark as Read
- Mark as New
- Bookmark
- Permalink
- Report Inappropriate Content
@rogerjdeangelis - wow, that's impressive. I've been working on a "toolbelt" of code snippets, but each job i've been at requires different data checks. Will take a look at yours, thanks so much for sharing!!
Chat soon
Chris
SAS AI and Machine Learning Courses
The rapid growth of AI technologies is driving an AI skills gap and demand for AI talent. Ready to grow your AI literacy? SAS offers free ways to get started for beginners, business leaders, and analytics professionals of all skill levels. Your future self will thank you.
- Find more articles tagged with:
- Data for learning
- Free Data Friday
