- Home
- /
- SAS Communities Library
- /
- Capturing Output Tables from SAS Visual Forecasting 8.5
- RSS Feed
- Mark as New
- Mark as Read
- Bookmark
- Subscribe
- Printer Friendly Page
- Report Inappropriate Content
Capturing Output Tables from SAS Visual Forecasting 8.5
- Article History
- RSS Feed
- Mark as New
- Mark as Read
- Bookmark
- Subscribe
- Printer Friendly Page
- Report Inappropriate Content
We frequently wish to capture the output tables from our forecasting projects. With SAS Visual Forecasting 8.5, it's easy to do! First, let’s review what tables are created.
Select any image to see a larger version.
Mobile users: To view the images, select the "Full" version at the bottom of the page.
Exporting output tables from Visual Forecasting 8.5 is as simple as simple as 1, 2, 3.
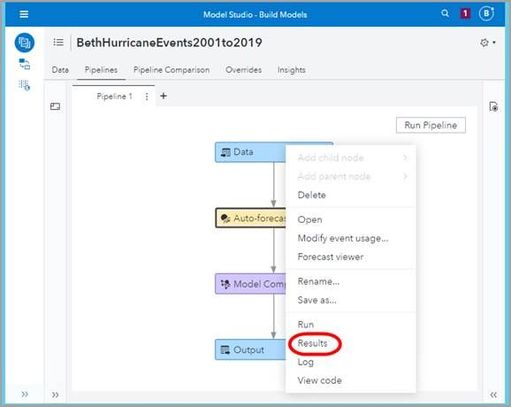
- From the Model Studio Pipelines tab, right click on forecast node, and open Results
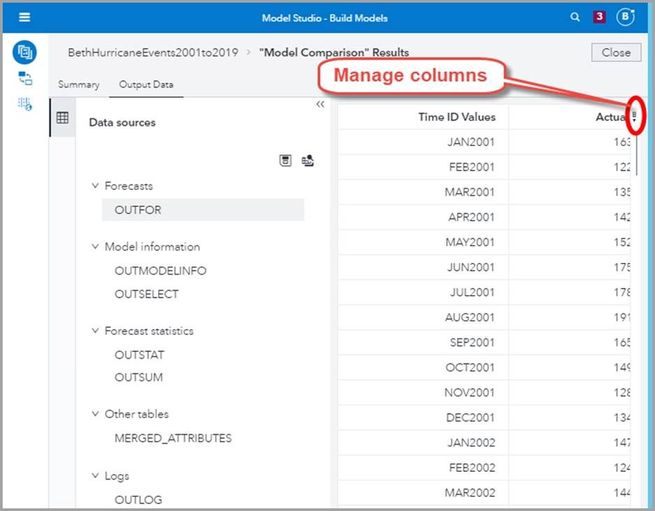
- Select Output Data tab, and select the table you want
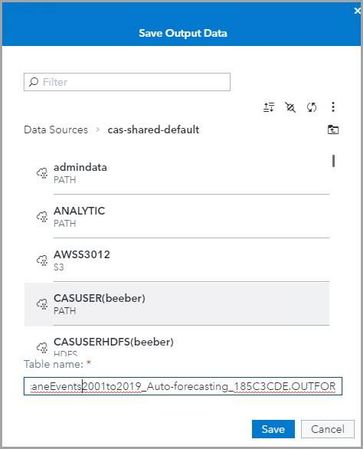
- Click Save icon
Below we will go step by step through this process and how to find and access our tables once they are saved. We'll also reveal an EVEN EASIER way to get your tables into Visual Analytics where you can explore and visualize them and use them in reports.
Let's review what the output attributes (columns) are for each table.
OUTFOR
- Time ID Values
- Actual Values
- Predicted Values
- Prediction Standard Errors
- Lower Confidence Limits
- Upper Confidence Limits
- Variable Name
- Prediction Errors
OUTMODELINFO
- Variable Name
- Model
- Model Family
- Dependent Variable Transform
- Seasonal Model
- Trend Model
- Inputs Present
- Events Present
- Outliers Present
- Model Status
- Model Source
OUTSELECT (All the OUTSTAT Plus Selected Status and Model Label)
- Variable Name
- Region
- Selection List
- Model
- Selected Status
- Degrees of Freedom Error
- Number of Observations
- Number of Observations Used
- Number of Missing Actuals
- Number of Missing Predicted Values
- Number of Model Parameters
- Total Sum of Squares
- Corrected Total Sum of Squares
- Sum of Square Error
- Mean Square Error
- Root Mean Square Error
- Unbiased Mean Square Error
- Unbiased Root Mean Square Error
- Mean Absolute Percent Error
- Mean Absolute Error
- R-Square
- Adjusted R-Square
- Amemiya’s Adjusted R-Square
- Random Walk R-Square
- Akaike Information Criterion
- Finite Sample Corrected Akaike Information Criterion
- Schwarz Bayesian Information Criterion
- Amemiya’s Prediction Criterion
- Maximum Error
- Minimum Error
- Maximum Percent Error
- Minimum Percent Error
- Mean Error
- Mean Percent Error
- Median Absolute Percent Error
- Geometric Mean Absolute Percent Error
- Minimum Predicted Percent Error
- Maximum Predicted Percent Error
- Mean Predicted Percent Error
- Mean Absolute Predicted Percent Error
- Median Absolute Predicted Percent Error
- Geometric Mean Absolute Predicted Percent Error
- Minimum Symmetric Percent Error
- Maximum Symmetric Percent Error
- Mean Symmetric Percent Error
- Mean Absolute Symmetric Percent Error
- Median Absolute Symmetric Percent Error
- Geometric Mean Absolute Symmetric Percent Error
- Minimum Relative Error
- Maximum Relative Error
- Mean Relative Error
- Mean Relative Absolute Error
- Median Relative Absolute Error
- Geometric Mean Relative Absolute Error
- Mean Absolute Scaled Error
- Minimum Absolute Error Percent of Standard Deviation
- Maximum Absolute Error Percent of Standard Deviation
- Mean Absolute Error Percent of Standard Deviation
- Median Absolute Error Percent of Standard Deviation
- Geometric Mean Absolute Error Percent of Standard Deviation
- Model Label
OUTSTAT
All the same attributes as OUTSELECT except does not include Selected Status and Model Label.
OUTSUM
- Variable Name
- Time Series Length
- Number of Nonmissing Values
- Number of Missing Values
- Minimum Value of Series
- Maximum Value of Series
- Mean Value of Series
- Standard Deviation of Series
- Condition Code for Series
MERGED_ATTRIBUTES
All variables from all the other tables merged into one table plus:
- Starting Time ID for Series
- Ending Time ID for Series
- Volume Volatility Class
- Seasonal
- Intermittent
- Seasonal Intermittent
- Retired
- Short
- Volume
- Volatility
- Demand Interval Measure
- Volatility Measure
- Status
OUTLOG
- _ERRNO_ Status
- Length of log content
- Log content
Let’s see how easy it is to export these tables!
We start with an already built SAS Visual Forecasting 8.5 model in Model Studio.
Here I’ll use the my Hurricane project, which I previously demonstrated in my previous article, Improve Accuracy by Adding Events in SAS Visual Forecasting 8.5 Model Studio.
FROM PIPELINES TAB
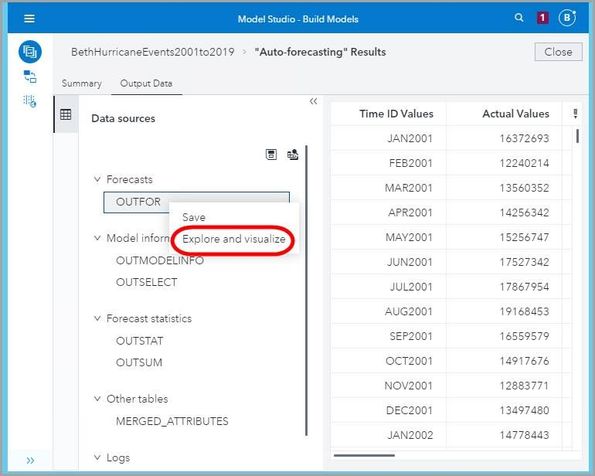
- From the Pipelines tab, Run Pipeline and then right click your modeling node. Select Results.
- Go to the Output Data tab. You see your list of output tables. Ensure that the first table OUTFOR is selected.
- On the far right is an icon to Manage Columns.
- In Manage Columns, you can hide or display columns at your convenience.
- To save the OUTFOR table as a CAS table, select the Save icon, or right click and select Save. It will be assigned a name, ending with OUTFOR.
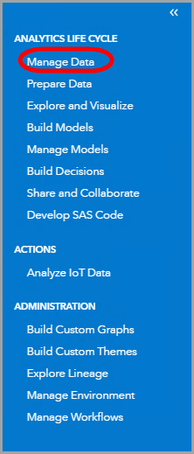
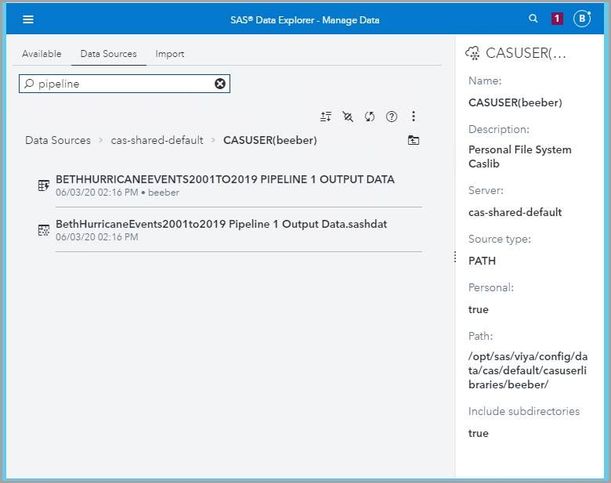
- Go to Manage Data.
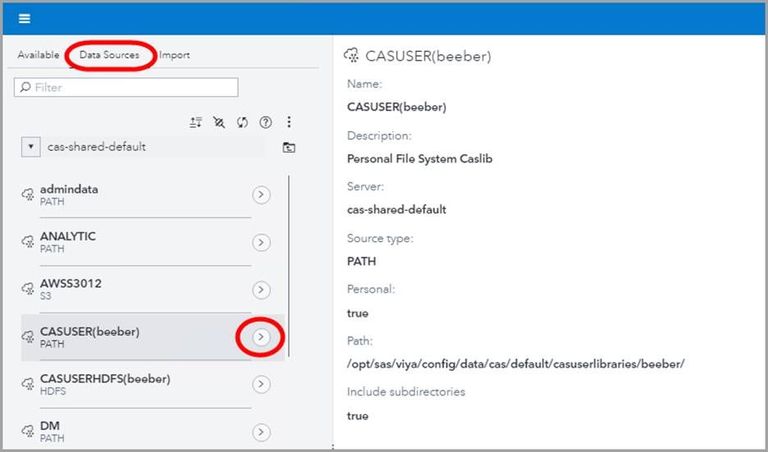
- Go to the Data Sources tab.
- You see the file you saved is now listed under your Data Sources as a data set.
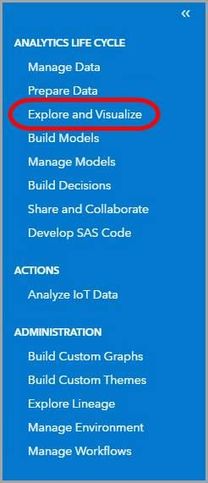
- You can now access that table from other SAS Viya applications. For example, open Visual Analytics (Explore and Visualize).
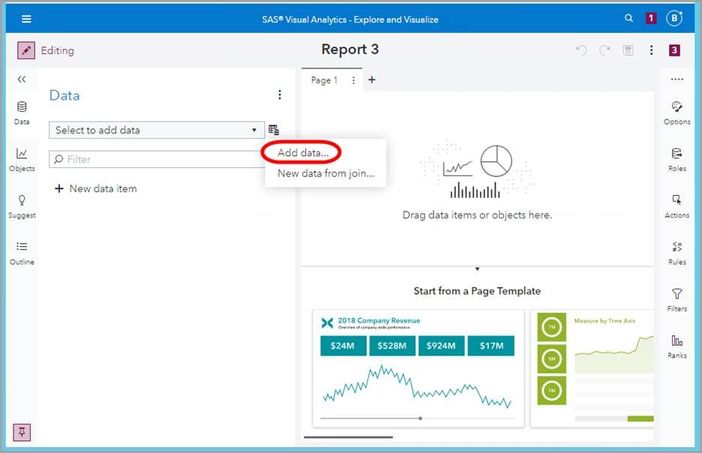
- Open a New Project, and select Add Data.
- Go to the Data Sources tab, and look under cas-shared-default, CASUSER(yourusername) to see the OUTFOR table. Ensure that Show unloaded tables is checked.
- Right click, Load the OUTFOR data set.
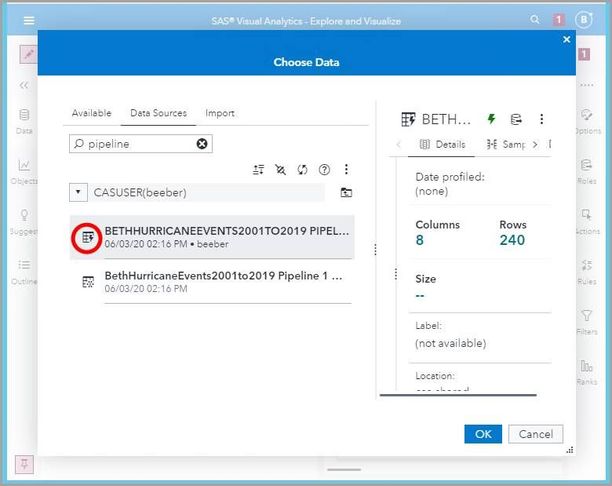
- Notice the lightning bolt icon, indicating that the data set is loaded.
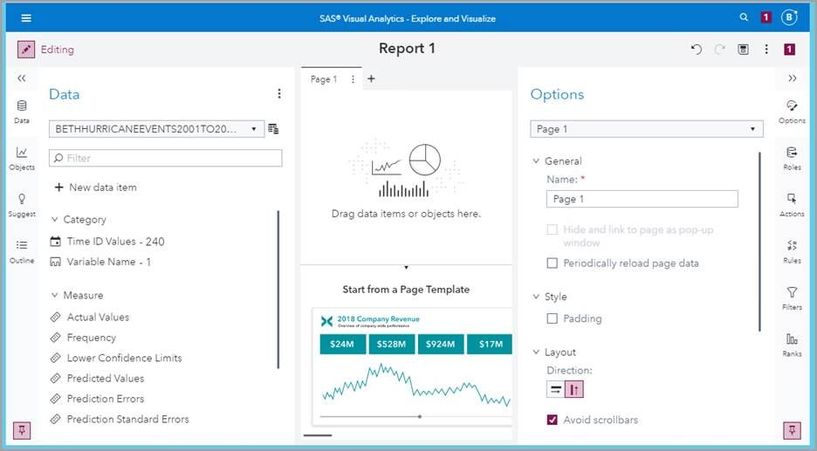
- Select the loaded data set and click OK.
You can now explore and/or report these results in SAS Visual Analytics. - For example, we may want to plot prediction errors by date.
SHORT CUT TO EXPLORE AND VISUALIZE VISUAL FORECASTING OUTPUT TABLES
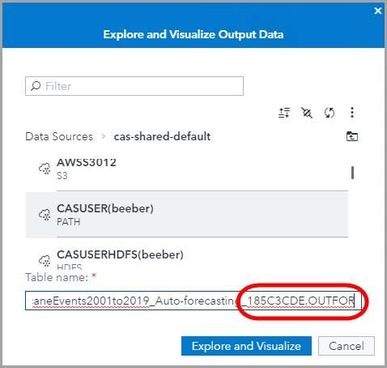
- Instead of Save, right click on OUTFOR and select Explore and Visualize. (Or alternatively, use the Explore and Visualize icon to the right of the Save icon.)
- Notice this will give it the same file name as earlier.
- We are asked if we want to overwrite the existing table. Select Overwrite.
- By using Explore and Visualize instead of Save, we don’t have to add the step of loading the data.
TO EXPORT FROM PIPELINE COMPARISONS TAB
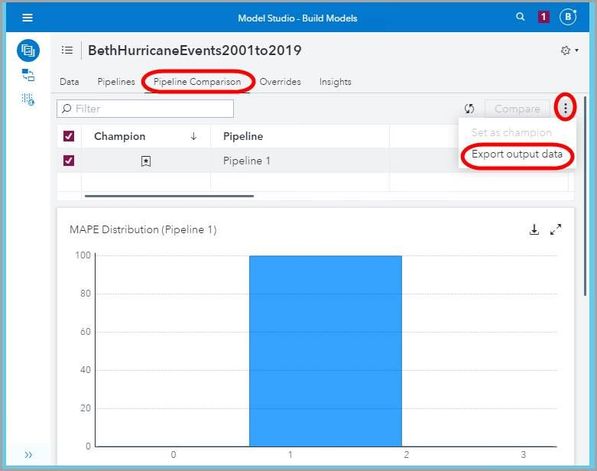
- Select the Pipeline you want to export output data for. Use the vertical ellipsis on the far right to Export output data.
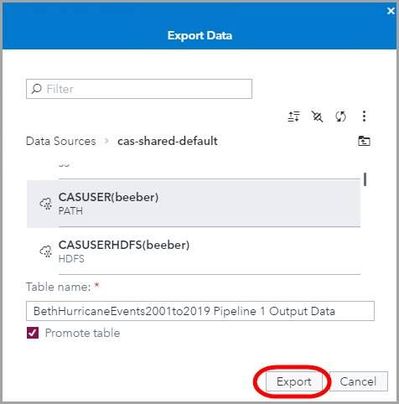
- Leave the default table name and ensure that Promote table is checked. Click Export.
- Go to Manage Data (SAS Data Explorer), Data Sources, and we see our OUTPUT DATA.
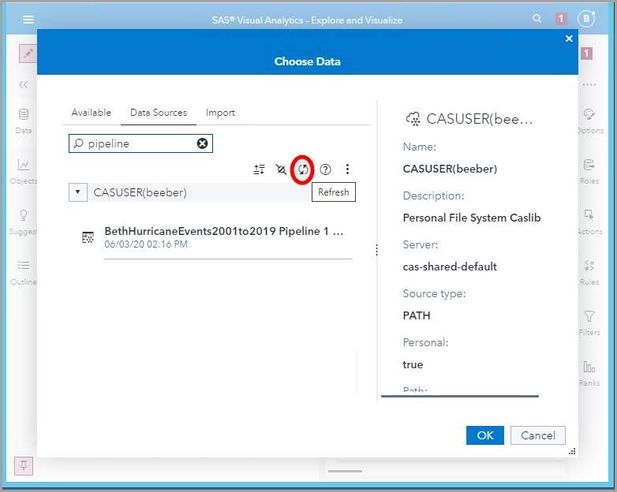
- Let’s now go to Explore and Visualize (SAS Visual Analytics) to look at these data. We don’t see the loaded data (remember the lightning bolt tells us that the data are loaded). Select Refresh.
- The loaded table with the lightning bolt appears. Select the table and hit OK.
- Notice that only the OUTFOR table data are there. Where are the other tables? The OUTFOR table is the only table exported from the Pipeline Comparison tab.
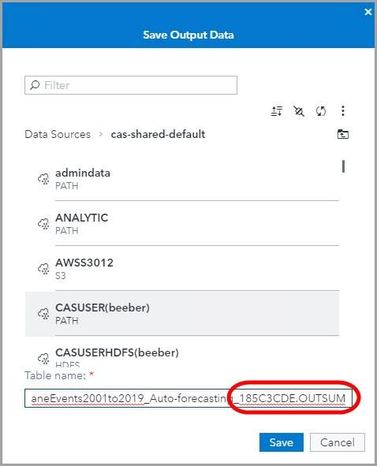
Let’s return and save our OUTSUM table.
TO DOWNLOAD SAS LOG
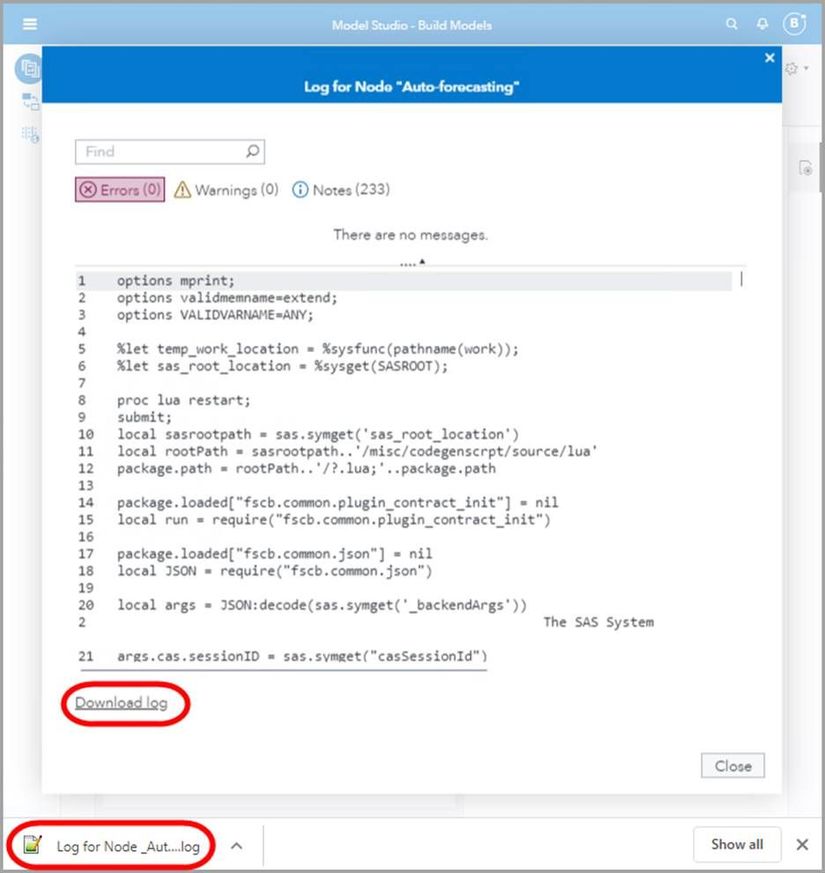
- In addition to the output tables, you can also easily get the SAS log. To get the SAS log, right click on your forecasting node.
- Select Download log and the log will be downloaded.
- The log will be downloaded by default to your Downloads folder.
For More Information
- Mark as Read
- Mark as New
- Bookmark
- Permalink
- Report Inappropriate Content
If I am using the SAS Batch API for a SAS Visual Forecasting Project, where are the Output Tables written ?
How can I access them within Batch; especially the output data for the Champions Model. ?
- Mark as Read
- Mark as New
- Bookmark
- Permalink
- Report Inappropriate Content
Hi Harald! Your output tables will be written where your batch code sends them. Check out this blog for some code examples: Exporting pluggable modeling node results tables t... - SAS Support Communities. Also, this email from Iman Vasheghani Farahani might also be helpful:
"You can see what the champion model is and export the respective OUTFOR table to any CASLIB you want. I highly recommend you follow that blog to get the tables you’re looking for. Alternatively, and if you cannot modify the modeling node codes (especially for built-in models like HF/PSNN), you can follow the steps coming below to get your tables. If you open the log for one of your modeling nodes, you should be able to locate notes like this when the session VF_SESSION connected to CAS. Once you find it, copy the CASLIB name (highlighted part) as we’ll need it later.
NOTE: The session VF_SESSION connected successfully to Cloud Analytic Services ivf.vfapp.sashq-d.openstack.sas.com using port 5570.
The UUID is 815d00d3-3977-9441-a367-968e68e7638c. The user is imvash and the active caslib is
Analytics_Project_cee08563-52fc-4750-a499-1a873baa4977.
NOTE: The SAS option SESSREF was updated with the value VF_SESSION.
NOTE: The SAS macro _SESSREF_ was updated with the value VF_SESSION.
NOTE: The session is using 0 workers.
Go to SAS Studio and submit the following commands:
cas mycas sessopts=(caslib="Analytics_Project_cee08563-52fc-4750-a499-1a873baa4977");
libname mylib cas sessref=mycas;
You should be able to see your tables in mylib. Note that mylib is linked to the caslib Analytics…, so you might want to save your table somewhere else, say in the CASUSER library. Following code in SAS Studio saves your tables (table_name) in CASUSER:
proc cas;
table.save /
table={caslib="Analytics_Project_cee08563-52fc-4750-a499-1a873baa4977", name="table_name"}
caslib="CASUSER"
name="table_name.sashdat"
replace=true
compress=true;
run;
You should bring them to memory before being able to make queries. Make a new cas session and use proc casutil to bring them in memory.
I hope it helps.
Iman"
- Mark as Read
- Mark as New
- Bookmark
- Permalink
- Report Inappropriate Content
And let me add a warning from Martin Schorter.
"Be very careful [trying the code mentioned above] in a production environment. The internal libraries and structures of VF are subject to change. The implementation may break at any time.
As Iman said, absolutely do not make any changes to the content in the project CASLIB or you might end up corrupting the project."
- Mark as Read
- Mark as New
- Bookmark
- Permalink
- Report Inappropriate Content
This has been extremely helpful! One question, is there a dataset is savable to CAS that includes the FF or Final Forecast variable? I don't see it in the OUTFOR table, just the predicted values. The predicted values do not include override adjustments, so that's why I ask. Thanks
- Mark as Read
- Mark as New
- Bookmark
- Permalink
- Report Inappropriate Content
I would like to know as well, which table or what library holds the FF (final forecast) that includes overrides.
- Mark as Read
- Mark as New
- Bookmark
- Permalink
- Report Inappropriate Content
Hi, @BethEbersole
Is that a way to add output data? For example, at the ATSM documantation are other output like outEst, is that a way put this output at the forecast results?
April 27 – 30 | Gaylord Texan | Grapevine, Texas
Registration is open
Walk in ready to learn. Walk out ready to deliver. This is the data and AI conference you can't afford to miss.
Register now and save with the early bird rate—just $795!
SAS AI and Machine Learning Courses
The rapid growth of AI technologies is driving an AI skills gap and demand for AI talent. Ready to grow your AI literacy? SAS offers free ways to get started for beginners, business leaders, and analytics professionals of all skill levels. Your future self will thank you.
- Find more articles tagged with:
- GEL


