- Home
- /
- SAS Communities Library
- /
- An Environment Manager Alert for VA 7.3 LASR Memory Use
- RSS Feed
- Mark as New
- Mark as Read
- Bookmark
- Subscribe
- Printer Friendly Page
- Report Inappropriate Content
An Environment Manager Alert for VA 7.3 LASR Memory Use
- Article History
- RSS Feed
- Mark as New
- Mark as Read
- Bookmark
- Subscribe
- Printer Friendly Page
- Report Inappropriate Content
[ Warning: This is a long blog. If you want to have a SAS EV alert indicating overuse of LASR server memory, then please continue ] Those of you who have used the SAS 9.4 Visual Analytics (7.3) Administrator application will be familiar with the ability to monitor the amount of memory being used by the LASR servers; both individually by LASR server, and also by individual tables loaded into LASR servers. We can't (easily) get that data into SAS Environment Manager (SAS EV) in realtime; however, I've discovered a method of monitoring the memory use and setting up an alert in SAS EV to warn the administrator when memory use is approaching an overflow point.
My colleague Gilles Chrzaszcz has already written two blogs illustrating how we can monitor LASR server availability from SAS EV--this blog takes another step and illustrates how we can set up an alert in SAS EV, such that we can be warned when LASR memory usage exceeds some specified threshhold. In thinking about LASR server memory use, a few things should be kept in mind:
- There's a global setting that is specified when installing VA which sets a limit to the physical memory used by a given node in an MPP deployment. By default, that percent is 75%, but that can be modified using the TABLEMEM option when starting a LASR server. This metric is at the node level however, and tells us overall LASR server memory usage for all LASR-related processes. Thus a 75% setting may restrict you to only 50% of LASR memory specifically for tables.
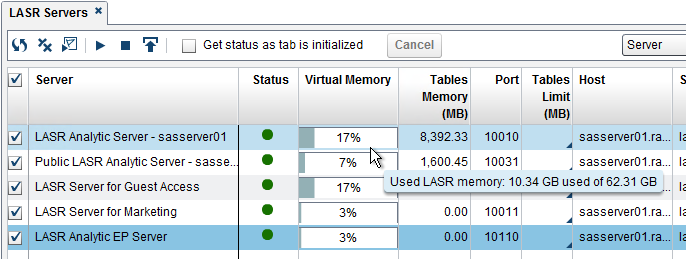
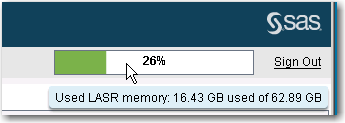
- The "Used LASR Memory" graph in the upper right indicates the amount of total memory, across all the machines being used by all processes, not just LASR server processes.
- Because of this, that number does not match the total memory used just by the LASR servers, as displayed by the sum of the percents in the Virtual Memory column for each server. This is the number that we're trying to replicate here--the sum of these percents: (17+7+17+3+3=47% here)
-
- Each LASR server uses some memory as overhead, whether or not it has any tables loaded at a particular moment. This overhead is estimated here to be approximately 2 GB per server--you can see the discrepancy in the screen shot above (8,392 MB vs. 10.34 GB). However, that "reserved" overhead memory can change as the servers fill up with data.
- Machine-level statistics on virtual memory aren't a close estimate of LASR server memory use, because they include other, non-LASR processes as well.
We can get a rough estimate of the amount of actual memory being used (and the percent of total used) at a given moment from two automatic tables that are created on the LASR Name node, named:
- _T_TABLEMEMORY
- _T_LASRMEMORY
These tables are created automatically, and constantly updated as tables are added to and deleted from the LASR servers. They provide the following variables (see full documentation at the link below):
- VirtualMemory
- ResidentMemory
- AllocatedMemory
- TableAllocatedMemory
- ...and a few more.
By getting an estimate of the total memory available across all machines in a deployment, and an estimate of how much is currently being used by the LASR servers and tables loaded into them, we can obtain a reasonable idea of the percent of memory resources that are being used, and thus how near we are to the limit. The following script and code will provide that estimate, which can serve as the basis for a SAS EV alert to fire when the threshold is becoming too high.
Here are the steps:
1. Get an estimate of the total memory available on your (distributed) LASR data nodes. This will be used as the denominator when calculating percent of memory in use. Since this number includes virtual as well as physical memory, it will be somewhat larger than the RAM figure you would get for your Linux machines. One way is to look at the number displayed when hovering the mouse over the memory graphic on the Administrator application in SAS VA (above). Here' we're estimating the total to be just over 62 GB.
2. Copy the following two files into the directory on your VA name node: (available at the link below) GetMemory.sas - estimates percent of memory used by tables GetMemory.sh - sets up environment and calls above program The directory to copy into is: <SAS_CONFIG>/Applications/SASVisualAnalytics/VisualAnalyticsAdministrator/ Set permissions:
- Two programs need execute permissions for user running them
- User running the script must have R/W access to directory above, and to the ./Logs directory and any files written into it.
3. Edit GetMemory.sas, and replace the following global macro variables with your values:
%let Maxmem = 66571993088 ; /* binary form of 62 GB*/
%let Machine = sasserver.demo.sas.com; /* host of the VA Name node */
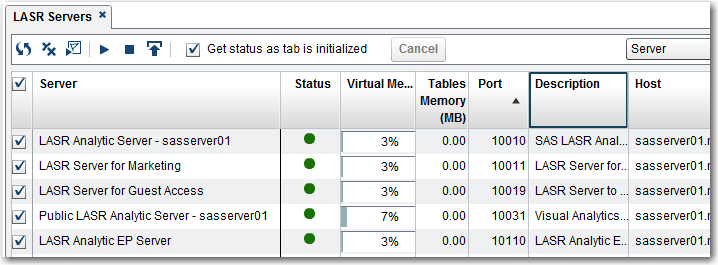
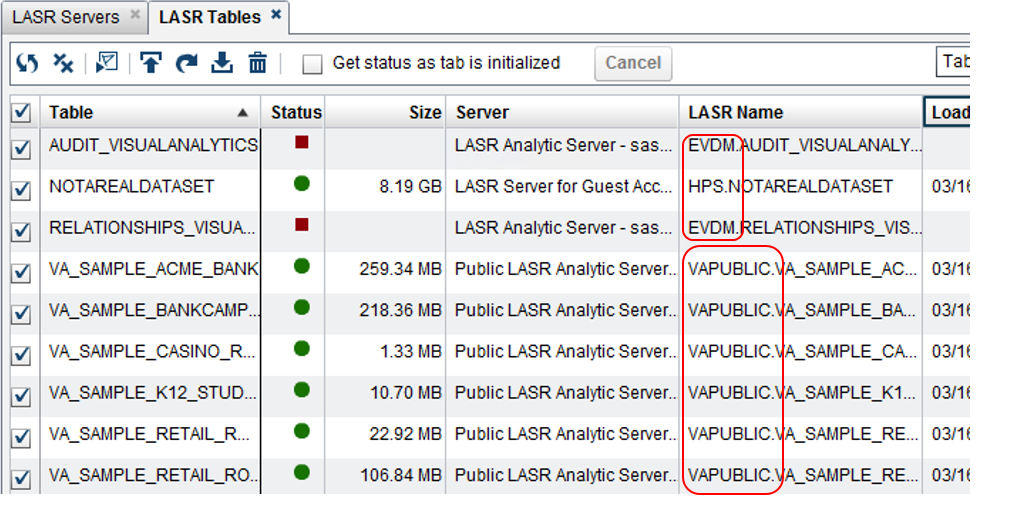
4. Log into your SAS Visual Analytics Administrator application, open the LASR Servers and LASR Tables tabs, and gather the following information about each LASR server in your installation:
- Name of the Server
- Port server is listening on
- Tag for that LASR server
- an arbitrary (but unique) name to be used as the libname
(The server tag can be obained from the LASR Tables tab (below); it's the first part of the "LASR Name" field. You can also look at the properties of the library associated with each LASR server in SAS MC to get the tag name)
5. Using the above information, substitute correct values into the macro calls near the bottom of the SAS program, GetMemory.sas. Create one macro call for each LASR server in your installation (five in this example). The data displayed above (partial), along with the server tag, yielded the following macro code:
6. Log into SAS Environment Manager as administrator (sasadm@saspw)
a. Resources->Browse->Platforms, select the machine hosting your LASR name node
b. Tools Menu->New Platform Service
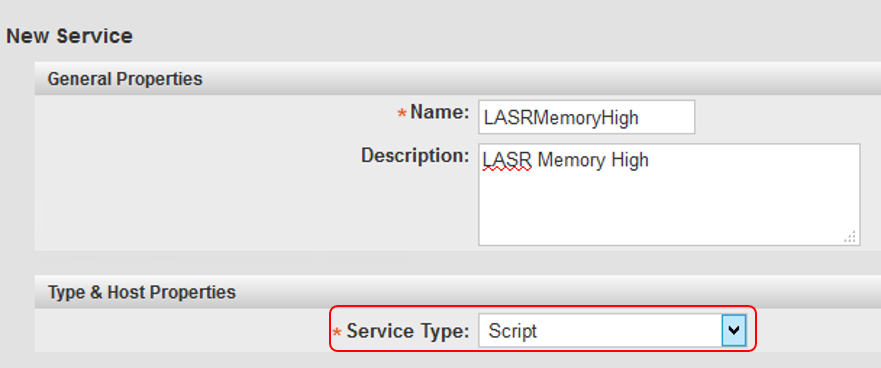
c. Name: LASRMemoryHigh Desc: LASR Memory High Type: Script
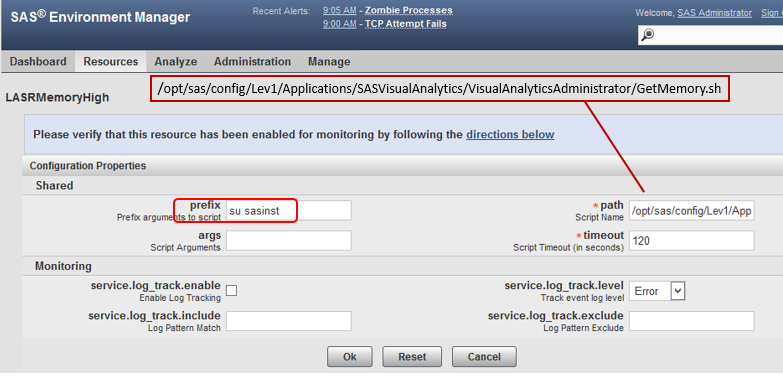
Click OK, and Edit Configuration Properties:
Path: Enter full pathname of the GetMemory.sh file.
Timeout: 120 seconds.
Enter the command "su <userID>", substituting the user ID that you want to be the owner of the process that runs the script (and therefore the SAS program). Click OK when done.
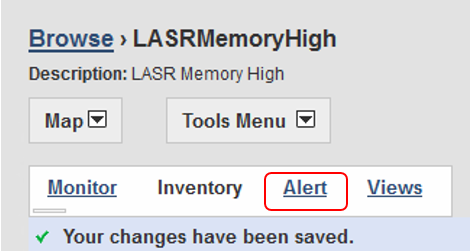
d. From the same LASRMemoryHigh page, Click Alert->Configure->New
e. Provide a name for the alert ("LASR Memory Alert") and optional description
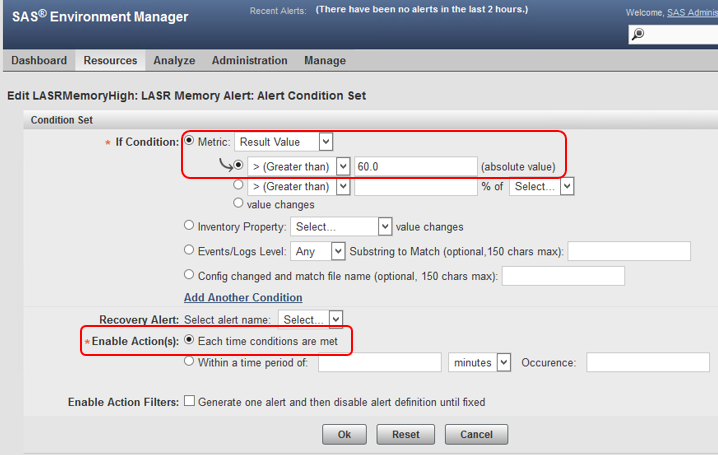
f. On the Alert Condition Set page, fill in the following: If Result Value > 60 Enable Action Each time Conditions are Met, click OK
g. On the dropdown list for an escalation scheme, you may use the default escalation scheme if desired (or customize your own)
h. From the Resource->Browse->Services page, locate your new resource, LASRMemoryHigh and select it
i. From the Monitoring page, select the Metric Data link
j. For all three metrics, specify a Collection Interval of 5 minutes and click the arrow. This means the script should run every five minutes.
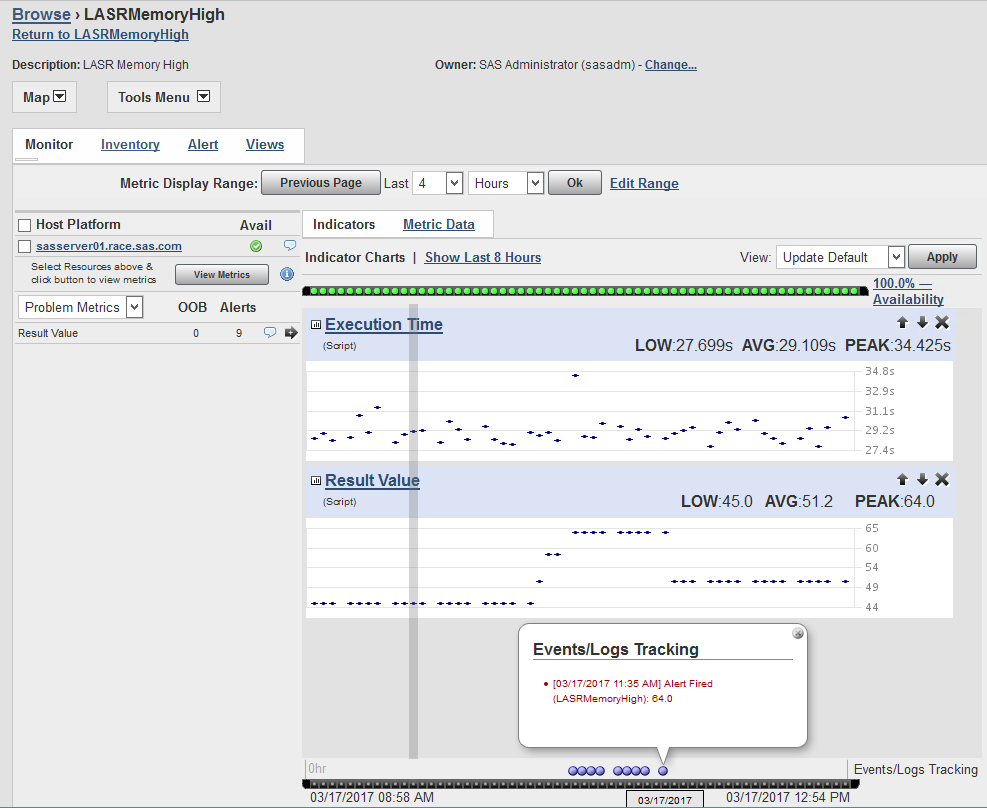
7. Allow several minutes for the new resource to be "discovered" and you should see the green Availability indicator. You can open the monitoring page and see if you are getting metrics after about 5-10 minutes:
The screen shot above shows what it might look like after running several hours. Notice that the metric called "Result Value" is the Percent Memory metric that we want, being passed back from the SAS program to the Linux script, and finally to the Environment Manager Script-type platform service. In this example the Result Value exceeded the setting of 60%, causing several alerts to fire. With experimenting you should find that this Result Value will be very close to the percentage you would get by summing the Virtual Memory column on the LASR Servers tab.
8. The SAS program that is called writes out a log and a listing (output) file with the tables and summaries used in the calculations. Access the Linux machine and navigate to the directories where the script was installed to locate these files:
./Logs/GetMemory.lst .
/Logs/GetMemory_<DateTime>.log
The logs can be used to verify the calculations or to troubleshoot. The *.lst file contains the data used to calculate the percentage memory use. If you want a detailed report on which LASR tables are taking up space, this output provides a sorted list, making it easy to locate the largest tables. Note also that the program writes out a single integer to the file called "PctValue.txt" that you can use to verify the percentage being passed (this information is also found in the SAS log file). This number should match the metric "Result Value" seen in the monitoring page of SAS EV.
To test the script fully, load some data sets into your LASR servers until it exceeds the levels that you expect or set as a maximum. With a bit of testing you should be able to set the threshhold in the alert condition to suit you. There are two basic adjustments you will want to make in order to fine-tune this alert to your system: 1) The threshold you set when defining the alert (here, 60%), and 2) how often you set the collection interval, which determines how often the script runs.
Another note: The SAS log files will accumulate quickly, depending on how often you set the script to run. You will want to either 1) turn off SAS logging, or 2) implement a clean-up script every few days/hours.
Reference: SAS LASR Analytic Server 2.7 Reference Guide
Code for GetMemory.sas:
/*  GetMemory.sas:  dumps basic LASR memory usage data- servers and tables */
/*  You need the listening ports for your LASR servers, and the tag name   */
/*  macro parameters are: libname, port, tag, label                        */
/* format for base-2 memory sizes (KB, MB, GB)  */

proc format;
   picture mykmg
      0 -< 1048576 = '009.9KB' (mult= 0.009765624)
      1048576 -< 1073741824 = '009.9MB' (mult= 9.5367431640625E-6)
      1073741824 - high = '000,009.9GB' (mult= 9.3132257461548E-9) ;
run;
%global Totmem; /* contains the sum of used memory across all machines */
%global Maxmem; /* contains the maximum memory available, across all machines */
%global PctUsed; /* output variable: contains estimated percent of memory used by LASR servers */ %global Machine; /* machine name of the LASR Head Node machine */
%let Totmem = 0; /* initialize once */
%let Maxmem = 66571993088 ; /* User must set this initially, depending on */
           /* system; here it's 62 MB, (binary form) */
%let Machine=sasserver01.race.sas.com; /* User must set this initially */
%macro GetMemory(libname=,port=,tag=,label=) ;
libname &libname. sasiola host="&Machine." port=&port. tag=&tag;
proc sort data=&libname.._T_lasrmemory out=lasrmemory;
   by hostname;
proc print data=lasrmemory ;
   by hostname;
   format VirtualMemory--childSMPTableMemory mykmg. ;
   title "&label - Memory Usage";
proc sql noprint; select count(*) into :numobs from &libname.._T_tablememory; quit;
%if (&numobs > 0) %then %do;  /* if any tables on this server */

data tablememory;
   set &libname.._T_tablememory;

proc sort data=tablememory;
   by tablename;

data tablememory;
   set tablememory;
   by tablename;
   array ins (*)  inMemorySize  UncompressedSize  CompressedSize  TableAllocatedMemory ;
   array outs (*) inMemorySizeS UncompressedSizeS CompressedSizeS TableAllocatedMemoryS;
   retain inMemorySizeS--TableAllocatedMemoryS TotRecords ;
   if first.tablename then do;
      do i=1 to dim(ins);
         outs(i) = 0;
         TotRecords = NumberRecords;
      end;
   end;
   do i=1 to dim(ins);
      if (ins(i) ne .) then outs(i) = outs(i) + ins(i);
   end;
   TotRecords = TotRecords + NumberRecords;
   if last.tablename then output;

   keep tablename inMemorySizeS--TableAllocatedMemoryS TotRecords RecordLength ;

proc sort data=tablememory;
   by descending inmemorysizeS ;

proc print data=tablememory;
   sum inMemorySizeS--TableAllocatedMemoryS ;
   format InMemorysizeS--tableAllocatedMemoryS mykmg. TotRecords RecordLength comma12. ;
title " &label. Table Memory Usage";

proc summary data=tablememory;
   var inMemorySizeS;
   output out=tagout sum=sumMem;
run;
proc print data=tagout;
title "sum of memory used";

data _null_ ;
   set tagout;
   call symput('MyMem', sumMem) ;
run;

%let Totmem = %eval(&Totmem + &MyMem);  /* adding memory for this server */

%end;

%let Totmem = %eval(&Totmem + 2147483648);  /* adding approx. 2 GB overhead */

%put Total Memory up to this point = &Totmem.;
%let PctUsed = %eval((&Totmem * 100) / &Maxmem);
%put Percent of Memory Used is up to this point =  &Pctused.;

%mend GetMemory;

/*  User must specify the following macro calls, one per LASR server  */

%getMemory(libname=example,port=10010,tag=evdm,label=LASR Analytic Server) ;

%getMemory(libname=example2,port=10031,tag=vapublic,label=Public LASR Server) ;

%getMemory(libname=example3,port=10019,tag=HPS,label=LASR Server for Guest Access) ;

%getMemory(libname=example4,port=10011,tag=GATE,label=LASR Server for Marketing) ;

%getMemory(libname=example5,port=10110,tag=HPSEP,label=LASR Analytic EP Server) ;

/*  get the final percentage value, and write it out to a file  */

filename PctFile "./Logs/PctValue.txt";

data _null_;
   file PctFile;
   length PctMem $3. ;
   PctMem = symget("Pctused") ;
   put PctMem 3. ;
   abort &Pctused.  ;  /* this passes the value to the calling script  */
run;
Code for GetMemory.sh:
- Mark as Read
- Mark as New
- Bookmark
- Permalink
- Report Inappropriate Content
hi Dave
ref. to your article at https://communities.sas.com/t5/SAS-Communities-Library/An-Environment-Manager-Alert-for-VA-7-3-LASR-....
From the shell script GetMemory.sh, you calling FILENAME="./GetMemory.sas", i can not find any GetMemory.sas ?
should it be FILENAME="./SummarizeMemory.sas" instead ?
- Mark as Read
- Mark as New
- Bookmark
- Permalink
- Report Inappropriate Content
For those wanting to read Gilles Chrzaszcz's 2 blog posts that @DaveNaden mentions above, they can be found at http://blogs.sas.com/content/sgf/author/gilleschrzaszcz/
Kind Regards,
Michelle
- Mark as Read
- Mark as New
- Bookmark
- Permalink
- Report Inappropriate Content
To the community,
I fixed the name of the SAS program so that it's GetMemory.sas.
-Dave Naden
- Mark as Read
- Mark as New
- Bookmark
- Permalink
- Report Inappropriate Content
Thanks to Michelle Homes for adding the links to Gilles' blogs. -Dave Naden
- Mark as Read
- Mark as New
- Bookmark
- Permalink
- Report Inappropriate Content
Perfect, thank you for quick reply !
Best Regards, Dagfinn Larsen
- Mark as Read
- Mark as New
- Bookmark
- Permalink
- Report Inappropriate Content
Hi
i have trouble to get the service "LASRMemoryHigh" to run from SAS Environment manager, the GetMemory.sas runs when i start it with GetMemory.sh from the linux shell, and with the sas installer user. The Availability indicatorbar is yellow and there is not any fresh log under <sasconfig>/Applications/SASVisualAnalytics/VisualAnalyticsAdministrator/Logs/.....
Any tip ?
Best Regards, Dagfinn Larsen
SAS AI and Machine Learning Courses
The rapid growth of AI technologies is driving an AI skills gap and demand for AI talent. Ready to grow your AI literacy? SAS offers free ways to get started for beginners, business leaders, and analytics professionals of all skill levels. Your future self will thank you.
- Find more articles tagged with:
- GEL
