- Home
- /
- Programming
- /
- ODS Reports
- /
- Re: proc report like decision tree diagram
- RSS Feed
- Mark Topic as New
- Mark Topic as Read
- Float this Topic for Current User
- Bookmark
- Subscribe
- Mute
- Printer Friendly Page

- Mark as New
- Bookmark
- Subscribe
- Mute
- RSS Feed
- Permalink
- Report Inappropriate Content
Hallo All,
I have the dataset reports with proc reports:
info CW is calendar-week
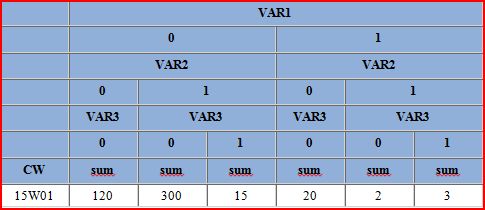
| VAR1 | ||||||
| 0 | 1 | |||||
| VAR2 | VAR2 | |||||
| 0 | 1 | 0 | 1 | |||
| VAR3 | VAR3 | VAR3 | VAR3 | |||
| 0 | 0 | 1 | 0 | 0 | 1 | |
| CW | sum | sum | sum | sum | sum | sum |
| 15W01 | 120 | 300 | 15 | 20 | 2 | 3 |
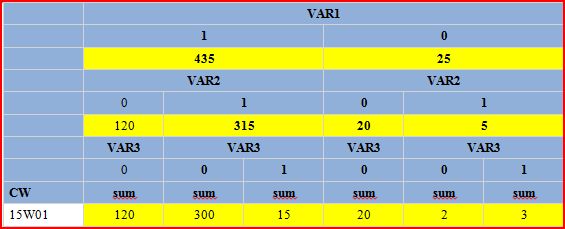
But I want to have the report like decision tree diagram:
| CW | VAR1 | |||||
| 15W01 | 435 | 25 | ||||
| VAR2 | VAR2 | |||||
| 120 | 315 | 20 | 5 | |||
| VAR3 | VAR3 | VAR3 | VAR3 | |||
| 120 | 300 | 15 | 20 | 2 | 3 | |
| sum | sum | sum | sum | sum | sum | |
| 120 | 300 | 15 | 20 | 2 | 3 | |
And so, for15W01, 15W02, 15W03, ….
I have only SAS BASE 9.4.
Can anyone know how to get this Report? Any help would be greatly appreciated.
Many Thanks,

- Mark as New
- Bookmark
- Subscribe
- Mute
- RSS Feed
- Permalink
- Report Inappropriate Content
Hi:
There are other procedures for SAS that do decision trees, but your example doesn't look like modeling. It looks more like a nested summary report. PROC REPORT and PROC TABULATE will both do summary reports, but won't "skip" variables on rows the way you show (such that VAR1 is in the middle. But, here's an example of what TABULATE would do for you (showing 15W01 only):
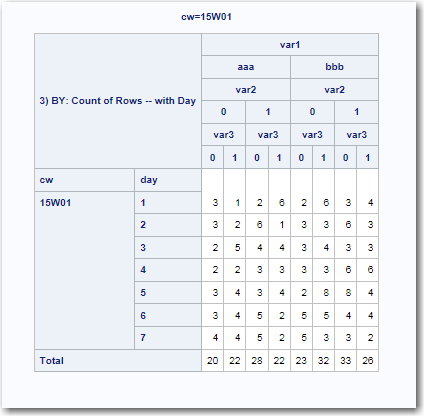
And, here's an example of what REPORT would do for you:
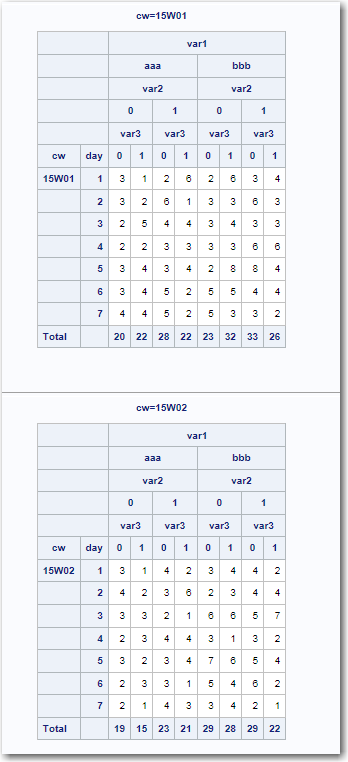
But of course, since you didn't post any input data, I had to make some fake data. So the structure of your input data will make a difference to the final code for you. For example, given that you said this was weekly data, I made a fake "DAY" variable, which you might not have in your data.
SAS does have procedures that do decision trees (PROC DTREE), but that is more for modeling than what you seem to show (simple SUM).
cynthia
- Mark as New
- Bookmark
- Subscribe
- Mute
- RSS Feed
- Permalink
- Report Inappropriate Content
Hi Cynthia,
Thanks a lot for your support. Maybe my text was not clear. here is the data for only CW 15W01
data decison;
input CK $ VAR1 VAR2 VAR3 SUM;
datalines;
15W01 0 0 0 120
15W01 0 1 0 300
15W01 0 1 1 15
15W01 1 0 0 20
15W01 1 1 0 2
15W01 1 1 1 3
;
run;
with proc report I have this table like your proc report table
But I want to have this table.I want have SUM for every variable or class
I can do with 3 different proc report table. but I must do or show only one proc report table.
Thanks
- Mark as New
- Bookmark
- Subscribe
- Mute
- RSS Feed
- Permalink
- Report Inappropriate Content
Hi:
That is rather dicey to produce, since the header values are placed in PROC REPORT header cells, one row at a time. So, at the point in time AFTER the VAR1 has been written on header row 1 and AFTER the 1 and 0 have been written on header row 2, there is no visibility of the value that was just written in the previous row in order to write the 435 and the 25. So that will be a challenge you might get around with some kind of macro programming. But I do not think that this is really possible with PROC REPORT without at LOT of pre-processing of the data or the report. If you have presummarized all the totals, you might be able to do this with a custom TABLE template or with the Report Writing interface and a DATA step. But really, I am doubtful that PROC REPORT will be able to give you what you want. You might want to check with Tech Support before you start investigating other technology, though.
cynthia

- Mark as New
- Bookmark
- Subscribe
- Mute
- RSS Feed
- Permalink
- Report Inappropriate Content
Hey, I know that this post is almost 4 years old, however, I am looking into something along the same lines. I have a Excel Template that displays data in a tree downward as subsets fo the the total. I was looking for Proc Report help to re-create this template, to reduce cut and paste to Excel.
What was you final solution?
.jpg")
Catch up on SAS Innovate 2026
Nearly 200 sessions are now available on demand with the SAS Innovate Digital Pass.
Explore Now →Learn how use the CAT functions in SAS to join values from multiple variables into a single value.

Find more tutorials on the SAS Users YouTube channel.
SAS Training: Just a Click Away
Ready to level-up your skills? Choose your own adventure.
-
4 replies
-
05-11-2015 05:11 AM
-
3215 views
-
0 likes
-
3 in conversation
-
