- Home
- /
- Programming
- /
- ODS Reports
- /
- Re: Reporting with file print & put
- RSS Feed
- Mark Topic as New
- Mark Topic as Read
- Float this Topic for Current User
- Bookmark
- Subscribe
- Mute
- Printer Friendly Page

- Mark as New
- Bookmark
- Subscribe
- Mute
- RSS Feed
- Permalink
- Report Inappropriate Content
Help!! The dataset I am working with looks like this (partial, but you get the idea):
Obs grouporder groupname Testcode Testname _VAR_ _NOBS_ _MEAN_ _STD_ _PROBS_ runv
1 1 Motor Skills 2 UHDRS Baseline 7 32.8571 6.2029 0.01563 1
2 1 Motor Skills 2 UHDRS _12_months 7 29.7143 7.5435 0.01563 1
3 1 Motor Skills 2 UHDRS change 7 -3.1429 9.0633 0.29688 1
4 1 Motor Skills 2 UHDRS preslope 7 5.5867 5.1828 0.04688 1
5 1 Motor Skills 2 UHDRS postslpe 7 1.7346 8.7497 0.57813 1
6 1 Motor Skills 2 UHDRS slopedif 7 -3.8520 12.1819 0.37500 1
7 1 Motor Skills 3 CHOREA Baseline 7 11.8571 3.7607 0.01563 1
8 1 Motor Skills 3 CHOREA _12_months 7 10.1429 1.8645 0.01563 1
9 1 Motor Skills 3 CHOREA change 7 -1.7143 2.3604 0.15625 1
10 1 Motor Skills 3 CHOREA preslope 7 1.2026 1.8614 0.15625 1
11 1 Motor Skills 3 CHOREA postslpe 7 -0.5874 2.2477 0.57813 1
12 1 Motor Skills 3 CHOREA slopedif 7 -1.7900 3.4145 0.37500 1
.
.
.
Using file print and put, I need to get it to look like this:
System
Baseline Month 12 Change
Mean (STD) Mean (STD) p-value
Motor Skills
UHDRS 32.9 (6.2) 29.7 (7.5) 0.297
CHOREA 11.9 (3.8) 10.1 (1.9) 0.156
GAIT 1.3 (0.5) 1.3 (0.8) 1.000
TANDEM 1.9 (1.1) 1.6 (1.4) 0.750
PULL 0.1 (0.4) 0.7 (0.8) 0.125
BALANCE TOTAL 3.3 (1.4) 3.6 (2.6) 1.000
Physical Function
TFC 6.6 (1.0) 7.0 (2.2) 0.625
FA 20.3 (2.2) 19.1 (3.2) 0.313
IS 77.1 (8.6) 71.4 (7.5) 0.281
Cognigtive impair
COWA 27.2 (8.2) 31.5 (13.9) 0.188
SYMBAL DIGIT 25.1 (5.1) 20.1 (7.2) 0.094
STROOP 1 45.9 (13.6) 38.3 (17.1) 0.047
STROOP 2 61.7 (19.4) 52.3 (22.5) 0.031
STROOP 3 29.4 (9.6) 28.1 (10.4) 0.406
MMSE 27.5 (2.5) 26.8 (2.6) 0.625
The problem I have is getting to data in the file print.
This is the code I have so far:
data _null_;
set allb;
by grouporder groupname testcode testname _var_ notsorted;
options nodate nonumber;
file print notitles;
if _n_=1 then do;
put @1 'System';
put / @20 'Baseline' @40 'Month 12' @60 'Change' ;
put @20 'Mean (STD)' @40 'Mean (STD)' @60 'p-value';
end;
if first.groupname then put // groupname @;
if first.testname then put / testname @;
run;
Which gives me:
System
Baseline Month 12 Change
Mean (STD) Mean (STD) p-value
Motor Skills
UHDRS
CHOREA
GAIT
TANDEM
PULL
BALANCE TOTAL
Physical Function
TFC
FA
IS
Cognigtive impair
COWA
SYMBAL DIGIT
STROOP 1
STROOP 2
STROOP 3
MMSE
Any help is much appreciated! The code must be file print with put statements!!

- Mark as New
- Bookmark
- Subscribe
- Mute
- RSS Feed
- Permalink
- Report Inappropriate Content
Hi:
Look at Examples 1a and 1b and Example 8 in the Creating Complex Reports paper: http://www2.sas.com/proceedings/forum2008/173-2008.pdf They look very like what you want. You could do this report with DATA _NULL_ and PUT statements, but you would probably need a custom TABLE template for that. With some data manipulation and some "helper" variables, you can do a report like this with PROC REPORT.
If you go to this web site Technical Papers and Presentations made by SAS staff and scroll down to 2008 papers, you will find this paper and the zip file of programs that were used for the examples.
cynthia

- Mark as New
- Bookmark
- Subscribe
- Mute
- RSS Feed
- Permalink
- Report Inappropriate Content
Are the three SLOPE related _VAR_s being displayed in the report?
- Mark as New
- Bookmark
- Subscribe
- Mute
- RSS Feed
- Permalink
- Report Inappropriate Content
The three slope vars will be a part of my final report. Once I understand how to get the data in there I'll be able to put the rest of the variables in there myself. I don't want the forum to solve all my problems haha!

- Mark as New
- Bookmark
- Subscribe
- Mute
- RSS Feed
- Permalink
- Report Inappropriate Content
If the issue is getting things like: 32.9 (6.2) then one approach would be to create a new text variable combining the values:
meanprint = catx(' ',put(mean,f4.1,'(',put(std,f4.1),')');
and have the put statement use the new variables.

- Mark as New
- Bookmark
- Subscribe
- Mute
- RSS Feed
- Permalink
- Report Inappropriate Content
Why are you trying to file/put it in the first place. Take some time, and create a dataset which looks like the output required - this can be done with SQL or basic datastep manipulation, then its simply a matter of proc reporting that datastep.
- Mark as New
- Bookmark
- Subscribe
- Mute
- RSS Feed
- Permalink
- Report Inappropriate Content
I am currently in grad school, and file print/put is required by my professor, partly because she's old school and partly because, I suspect, she wants to make me suffer ![]()
- Mark as New
- Bookmark
- Subscribe
- Mute
- RSS Feed
- Permalink
- Report Inappropriate Content
This is close. It's been a while since I use FILE PRINT, if you post more data we can write the parts to deal with bottom of the page "lines left" and the rest.
infile cards firstobs=2;
input grouporder groupname &$16. Testcode $ Testname $
_VAR_ :$16. _NOBS_ _MEAN_ _STD_ _PROBS_ runv;
cards;
grouporder groupname Testcode Testname _VAR_ _NOBS_ _MEAN_ _STD_ _PROBS_ runv
1 Motor Skills 2 UHDRS Baseline 7 32.8571 6.2029 0.01563 1
1 Motor Skills 2 UHDRS _12_months 7 29.7143 7.5435 0.01563 1
1 Motor Skills 2 UHDRS change 7 -3.1429 9.0633 0.29688 1
1 Motor Skills 2 UHDRS preslope 7 5.5867 5.1828 0.04688 1
1 Motor Skills 2 UHDRS postslpe 7 1.7346 8.7497 0.57813 1
1 Motor Skills 2 UHDRS slopedif 7 -3.8520 12.1819 0.37500 1
1 Motor Skills 3 CHOREA Baseline 7 11.8571 3.7607 0.01563 1
1 Motor Skills 3 CHOREA _12_months 7 10.1429 1.8645 0.01563 1
1 Motor Skills 3 CHOREA change 7 -1.7143 2.3604 0.15625 1
1 Motor Skills 3 CHOREA preslope 7 1.2026 1.8614 0.15625 1
1 Motor Skills 3 CHOREA postslpe 7 -0.5874 2.2477 0.57813 1
1 Motor Skills 3 CHOREA slopedif 7 -1.7900 3.4145 0.37500 1
;;;;
run;
proc print;
where _var_ not in: ('pres' 'postsl' 'sloped');
run;
proc format;
invalue vcol(upcase just) 'BASELINE'=20 '_12_MONTHS'=40 'CHANGE'=60;
run;
options center=0;
data _null_;
set sys;
by grouporder groupname testcode testname _var_ notsorted;
where _var_ not in: ('pres' 'postsl' 'sloped');
file print notitles header=header;
if first.groupname then put groupname;
if first.testname then put @3 testname @;
col = input(_var_,vcol.);
select(upcase(_var_));
when('BASELINE','_12_MONTHS') put @col _mean_ +(-1) '(' _std_ +(-1) ')' @;
when('CHANGE') put @col _probs_ @;
otherwise;
end;
if last.testname then put;
format _mean_ 10.1 _std_ 10.2 _probs_ pvalue.;
return;
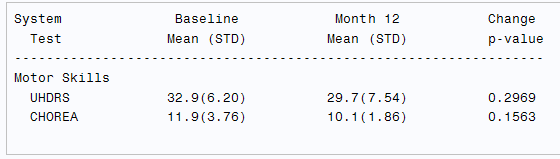
header:
put @1 'System' @20 ' Baseline' @40 ' Month 12' @60 'Change';
put @3 'Test' @20 'Mean (STD)' @40 'Mean (STD)' @60 'p-value';
put @1 66*'-';
run;
.jpg")
Catch up on SAS Innovate 2026
Nearly 200 sessions are now available on demand with the SAS Innovate Digital Pass.
Explore Now →Learn how use the CAT functions in SAS to join values from multiple variables into a single value.

Find more tutorials on the SAS Users YouTube channel.
SAS Training: Just a Click Away
Ready to level-up your skills? Choose your own adventure.
-
7 replies
-
07-13-2015 08:45 PM
-
2698 views
-
6 likes
-
5 in conversation
-
