- Home
- /
- Programming
- /
- ODS Reports
- /
- Re: PROC REPORT line @ formatting
- RSS Feed
- Mark Topic as New
- Mark Topic as Read
- Float this Topic for Current User
- Bookmark
- Subscribe
- Mute
- Printer Friendly Page

- Mark as New
- Bookmark
- Subscribe
- Mute
- RSS Feed
- Permalink
- Report Inappropriate Content
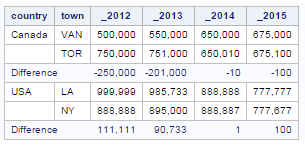
This is a continuation of a report that I previously received help with (https://communities.sas.com/message/277590), but since this a different issue, I decided to open another discussion. Xia Keshan helped me with the below code (although I added a couple of columns for demonstration purposes) to calculate row subtractions and it works well. The problem I'm having is formatting the computed variables to display nicely under the respective columns in the line @ statement. I've tried applying different commaW. widths, but the unless the subtractions results are the same size the alignment gets skewed. I've also tried to right justify the @line, but since each BREAK AFTER subtraction can have 1-4 digit differences, the results start off aligned, but get offset by different result widths. I appreciate any help. Thank you, Tim.
data have;
input country $ town $ _2012 : comma12. _2013 : comma12. _2014 : comma12. _2015 : comma12. ;
format _2012 _2013 _2014 _2015 : comma12.;
cards;
USA LA 999,999 985,733 888,888 777,777
USA NY 888,888 895,000 888,887 777,677
Canada VAN 500,000 550,000 650,000 675,000
Canada TOR 750,000 751,000 650,010 675,100
;
run;
proc report data=have nowd ;
column country town _2012 _2013 _2014 _2015;
define country/order;
define town/display;
define _2012/display;
define _2013/display;
define _2014/display;
define _2015/display;
compute before country;
n=0;
endcomp;
compute _2015;
n+1;
if n=1 then do;sum_2012=_2012;sum_2013=_2013;sum_2014=_2014;sum_2015=_2015;end;
else do;sum_2012+-1*_2012;sum_2013+-1*_2013;sum_2014+-1*_2014;sum_2015+-1*_2015; end;
endcomp;
compute after country;
line @1'Difference' @17 sum_2012 comma12. sum_2013 comma12. sum_2014 comma12. sum_2015 comma12.;
endcomp;
run;

- Mark as New
- Bookmark
- Subscribe
- Mute
- RSS Feed
- Permalink
- Report Inappropriate Content
Maybe this comes closer to the output you want?
data _null_;
/* the example data above isn't long enough for 'Difference' to appear in same column*/
length country $12.;
set have;
file print ods = (variables=(country town _2012 _2013 _2014 _2015));
format _2012 _2013 _2014 _2015 comma12.;
d2 = dif(_2012);
d3 = dif(_2013);
d4 = dif(_2014);
d5 = dif(_2015);
format d2 d3 d4 d5 comma12.;
if mod(_n_,2) = 1 then
put country town _2012 _2013 _2014 _2015;
else do;
country='';
put country town _2012 _2013 _2014 _2015;
put 'Difference' @3 d2 d3 d4 d5; /* with File ODS the column pointer refers to columns, not spaces*/
end;
run;

- Mark as New
- Bookmark
- Subscribe
- Mute
- RSS Feed
- Permalink
- Report Inappropriate Content
Hi: This is one reason NOT to use @ pointer control with PROC REPORT. There are other techniques you can use to change your summary line. See the code below. After you understand that the "EXTRABRK" variable is doing the "regular" summarizing and then the RBREAK numbers are being adjusted in the COMPUTE blocks for HEIGHT and WEIGHT -- then you can use NOPRINT to hide the EXTRABRK and the SOMENUMBER columns.
Cynthia
ods _all_ close; title; footnote;
options missing=' ';
data class;
length extrabrk name $20;
set sashelp.class;
if name = 'Alfred' then somenumber = 10;
else if name = 'Barbara' then somenumber = -5;
extrabrk = 'x';
run;
ods html file='c:\temp\changesum.html' ;
proc report data=class nowd;
column extrabrk name somenumber age height weight sex;
define extrabrk / order /* noprint */ ;
define name / order;
define somenumber / sum /* noprint */ ;
break after extrabrk / summarize;
rbreak after / summarize;
** put type of summary in name column;
compute after extrabrk;
name = 'Normal summary';
endcomp;
compute after;
name = 'Adjusted numbers';
endcomp;
** now adjust HEIGHT and WEIGHT and AGE on last summary line;
compute height;
if _break_ = '_RBREAK_' then height.sum = 1111;
endcomp;
compute weight;
if _break_ = '_RBREAK_' then do;
weight.sum = age.sum * 1000;
** change age.sum after using the original value for the weight column;
age.sum = somenumber.sum;
end;
endcomp;
run;
ods _all_ close;
- Mark as New
- Bookmark
- Subscribe
- Mute
- RSS Feed
- Permalink
- Report Inappropriate Content
I would actually use a combo of DATA step and PROC REPORT "helper" columns to do this.
Cynthia
** make the 2nd row of each data "pair" negative by creating some extra variables;
data have;
length country $20;
input country $ town $ _2012 : comma12. _2013 : comma12. _2014 : comma12. _2015 : comma12. ;
array orig (4) _2012 _2013 _2014 _2015;
array subtr (4) d_2012 d_2013 d_2014 d_2015;
if mod(_n_,2) = 0 then do;
do i = 1 to 4 by 1;
subtr(i) = orig(i) * -1;
end;
end;
else do;
do i = 1 to 4 by 1;
subtr(i) = orig(i) ;
end;
end;
format _2012 _2013 _2014 _2015 d_2012 d_2013 d_2014 d_2015: comma12.;
cards;
USA LA 999,999 985,733 888,888 777,777
USA NY 888,888 895,000 888,887 777,677
Canada VAN 500,000 550,000 650,000 675,000
Canada TOR 750,000 751,000 650,010 675,100
;
run;
ods html file='c:\temp\alternate_method.html' style=htmlblue;
proc report data=have nowd
style(summary)=Header;
column country town _2012 _2013 _2014 _2015 d_2012 d_2013 d_2014 d_2015;
define country/order style(column)=Header;
define town/display style(column)=Header;
define _2012/sum ;
define _2013/sum ;
define _2014/sum ;
define _2015/sum ;
define d_2012/sum noprint;
define d_2013/sum noprint;
define d_2014/sum noprint;
define d_2015/sum noprint;
break after country / summarize;
compute after country;
** move the subtracted values into the other columns;
country='Difference';
_2012.sum = d_2012.sum;
_2013.sum = d_2013.sum;
_2014.sum = d_2014.sum;
_2015.sum = d_2015.sum;
endcomp;
run;
ods html close;
- Mark as New
- Bookmark
- Subscribe
- Mute
- RSS Feed
- Permalink
- Report Inappropriate Content
Thanks Cynthia,
I now have had the opportunity to use your solution quite a few times. It works very well. For those that may choose to use it also, given the usage of mod(_n_,2) to multiple every second record by -1 assumes that you have 2 matching records to subtract and if you don't, the signs in the difference line after that single/unmatched record get thrown off. This does work very well however.

- Mark as New
- Bookmark
- Subscribe
- Mute
- RSS Feed
- Permalink
- Report Inappropriate Content
Yeah. That is why need a lot of time to adjust its style .
Code: Program
data have;
input country  $   town   $   _2012 : comma12.   _2013 : comma12.  _2014 : comma12.  _2015 : comma12. ;
format _2012   _2013 _2014   _2015 : comma12.;
cards;
USA LA 999,999 985,733 888,888 777,777
USA NY 888,888 895,000 888,887 777,677
Canada VAN 500,000 550,000 650,000 675,000
  Canada TOR 750,000 751,000 650,010 675,100
;
run;
proc report data=have nowd ;
column country   town   _2012 _2013 _2014 _2015;
define country/order;
define town/display;
define _2012/display;
define _2013/display;
define _2014/display;
define _2015/display;
compute before country;
n=0;
endcomp;
compute _2015;
n+1;
if n=1 then do;sum_2012=_2012;sum_2013=_2013;sum_2014=_2014;sum_2015=_2015;end;
  else do;sum_2012+-1*_2012;sum_2013+-1*_2013;sum_2014+-1*_2014;sum_2015+-1*_2015; end;
endcomp;
compute after country;
if country='Canada' then do;a1=23; a2=34;a3=50;a4=64;end;
else if country='USA' then do;a1=23;a2=35;a3=52;a4=66;end;

line @1'Difference' @a1 sum_2012 comma8. @a2 sum_2013 comma8. @a3 sum_2014 comma8. @a4 sum_2015 comma8.;
endcomp;
run;
Xia Keshan
.jpg")
Catch up on SAS Innovate 2026
Nearly 200 sessions are now available on demand with the SAS Innovate Digital Pass.
Explore Now →Learn how use the CAT functions in SAS to join values from multiple variables into a single value.

Find more tutorials on the SAS Users YouTube channel.
SAS Training: Just a Click Away
Ready to level-up your skills? Choose your own adventure.
-
5 replies
-
06-17-2015 12:50 PM
-
3485 views
-
0 likes
-
4 in conversation
-
