- Home
- /
- Programming
- /
- ODS Reports
- /
- PROC REPORT: SPANNING HEADER ISSUE
- RSS Feed
- Mark Topic as New
- Mark Topic as Read
- Float this Topic for Current User
- Bookmark
- Subscribe
- Mute
- Printer Friendly Page

- Mark as New
- Bookmark
- Subscribe
- Mute
- RSS Feed
- Permalink
- Report Inappropriate Content
Hello,
I have run into a strange issue with spanning header that I am using in PROC report.
The code below creates a dataset and using that data, it creates a report in excel using excelxp tagsets. The code and report is attached below.
data test;
infile datalines dlm=' ';
input family $ loans balance estimated loss;
datalines;
CLASS_A 17 1060290.87 792859.9416 211334.9232
CLASS_B 1 64080.76 44802.41218 17165.10972
CLASS_C 82 5532596.89 3650131.294 39484.41727
;
run;
ods tagsets.excelxp file='~/test.xls';
%let color = CXC2D69A;
proc report data=work.test ls=96 center missing style(header)=[background=CXDBE5F1];
column family ('MY SPANNING HEADER' loans balance avg_bal percnt estimated loss);
define family / group format= $8. width=8 left "FAMILY" style(column)=[background = CXDBE5F1];
define loans / sum format= best9. width=9 right "LOANS" style(header)=[background = &color.];
define balance / sum format= best9. width=9 right "BALANCE" style(header)=[background = &color.];
define estimated / sum format= best9. width=9 right "ESTIMATED" style(header)=[background = &color.];
define avg_bal / computed format= best20. width=20 right "AVG BALANCE" style(header)=[background = &color.];
define percnt / computed format= percent10.3 width=15 right "BAL (%) OF TOTAL" style(header)=[background = &color.];
define loss / sum format= best9. width=9 right "LOSS" style(header)=[background = &color.];
compute before;
total_bal = balance.sum;
endcomp;
compute percnt;
percnt = balance.sum/total_bal;
if _break_ = '_RBREAK_' then call define(_col_,'style','style=[background=&color.]');
endcomp;
compute avg_bal;
avg_bal = _c3_/_c2_;
if _break_ = '_RBREAK_' then call define(_col_,'style','style=[background=&color.]');
endcomp;
rbreak after /
summarize
style(summary) = {font_weight = bold
font_face = 'Arial, Helvetica, Sans-Serif'
font_size = 7pt
background = CXDBE5F1
foreground = black};
compute after;
family = 'TOTAL';
endcomp;
compute loans;
if _break_ = '_RBREAK_' then call define(_col_,'style','style=[background=&color.]');
endcomp;
compute balance;
if _break_ = '_RBREAK_' then call define(_col_,'style','style=[background=&color.]');
endcomp;
compute estimated;
if _break_ = '_RBREAK_' then call define(_col_,'style','style=[background=&color.]');
endcomp;
compute loss;
if _break_ = '_RBREAK_' then call define(_col_,'style','style=[background=&color.]');
endcomp;
run;
ods tagsets.excelxp close;
HERE IS THE OUTPUT OF THE CODE ABOVE:
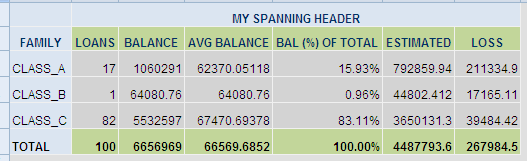
Now I want the background of 'MY SPANNING HEADER' as green. Since this is a spanning header, I was not able to easily change the background color. So i have used a trick that was suggested in my previous posting to change the color. basically i have a dummy variable that I am using it as 'ACROSS' usage so that I can change the color in my DEFINE statement.
I got the color that I needed but The issue is when I do that - the 'avg balance' and 'bal (%) of total' is populated as missing.
Below is the new code and the report I get.
input family $ loans balance estimated loss ;
datalines;
CLASS_A 17 1060290.87 792859.9416 211334.9232
CLASS_B 1 64080.76 44802.41218 17165.10972
CLASS_C 82 5532596.89 3650131.294 39484.41727
;
run;
data test1;
set test;
dummy = ' ';
run;
ods tagsets.excelxp file='~/test1.xls';
%let color = CXC2D69A;
proc report data=work.test1 ls=96 center missing style(header)=[background=CXDBE5F1];
column family dummy,(loans balance avg_bal percnt estimated loss);
define family / group format= $8. width=8 left "FAMILY" style(column)=[background = CXDBE5F1];
define loans / sum format= best9. width=9 right "LOANS" style(header)=[background = &color.];
define balance / sum format= best9. width=9 right "BALANCE" style(header)=[background = &color.];
define estimated / sum format= best9. width=9 right "ESTIMATED" style(header)=[background = &color.];
define avg_bal / computed format= best20. width=20 right "AVG BALANCE" style(header)=[background = &color.];
define percnt / computed format= percent10.3 width=15 right "BAL (%) OF TOTAL" style(header)=[background = &color.];
define loss / sum format= best9. width=9 right "LOSS" style(header)=[background = &color.];
define dummy / across format= $8. width=8 left "MY SPANNING HEADER" style(header)=[background = &color.];
compute before;
total_bal = balance;
endcomp;
compute percnt;
percnt = balance/total_bal;
if _break_ = '_RBREAK_' then call define(_col_,'style','style=[background=&color.]');
endcomp;
compute avg_bal;
avg_bal = _c3_/_c2_;
if _break_ = '_RBREAK_' then call define(_col_,'style','style=[background=&color.]');
endcomp;
rbreak after /
summarize
style(summary) = {font_weight = bold
font_face = 'Arial, Helvetica, Sans-Serif'
font_size = 7pt
background = CXDBE5F1
foreground = black};
compute after;
family = 'TOTAL';
endcomp;
compute loans;
if _break_ = '_RBREAK_' then call define(_col_,'style','style=[background=&color.]');
endcomp;
compute balance;
if _break_ = '_RBREAK_' then call define(_col_,'style','style=[background=&color.]');
endcomp;
compute estimated;
if _break_ = '_RBREAK_' then call define(_col_,'style','style=[background=&color.]');
endcomp;
compute loss;
if _break_ = '_RBREAK_' then call define(_col_,'style','style=[background=&color.]');
endcomp;
run;
ods tagsets.excelxp close;
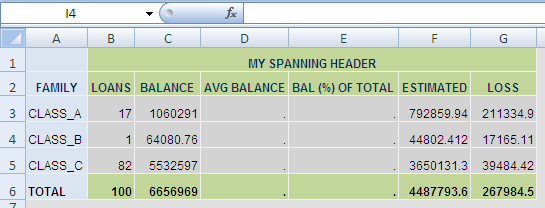
HERE IS THE NEW REPORT:
It changed the spanning header background color but the 'avg balance' and 'bal (%) of total' is populated as missing.
The report I would need is shown below:
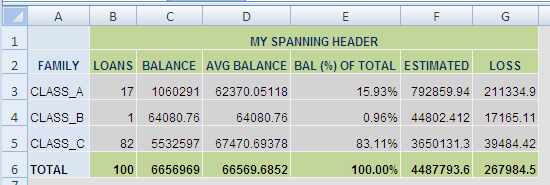
Any ideas on how to accomplish this. I would appreciate your help.
Thank you,
PS
Accepted Solutions

- Mark as New
- Bookmark
- Subscribe
- Mute
- RSS Feed
- Permalink
- Report Inappropriate Content
Hi:
When I answered your previous posting, I showed how the COMPUTE block had to change when you introduced an ACROSS item into the mix. Your COMPUTE block cannot refer to the simple column names anymore. So, you will have to refer to the variables by their absolute column number in the computation. That is why the values are missing on every row. There are tradeoffs on every thing you do in your scenario and if the cosmetics of the spanning header is so critical, then you will have to bite the bullet and switch to absolute column headers in your COMPUTE block.
I showed this a bit in the previous code I posted. I have modified your code to show the summary line the way you want. I also got rid of options that are ignored by PROC REPORT (such as WIDTH= or LS=). In addition, ( fixed the compute blocks. Anytime you run PROC REPORT and see that a variable is "unitialized" in the LOG, this is a clue that there's something wrong with the COMPUTE block syntax. I annotated the absolute column numbers in the code below /* xxx */ is an "inline" comment just for your benefit so you could see how the changes in the COMPUTE block correspond to the absolute column number items.
Hope this gets you back on track.
cynthia
data test;
input family $ loans balance estimated loss ;
dummy = ' ';
datalines;
CLASS_A 17 1060290.87 792859.9416 211334.9232
CLASS_B 1 64080.76 44802.41218 17165.10972
CLASS_C 82 5532596.89 3650131.294 39484.41727
;
run;
ods tagsets.excelxp file='c:\temp\test1.xml';
%let color = CXC2D69A;
** I find it works better for me logically to arrange my DEFINE variables;
** in the same order as they appear on the COLUMN statement. Then if I;
** do have to use absolute column numbers, it is easier to figure out the;
** numbers.;
proc report data=work.test nowd center missing
style(header)=[background=CXDBE5F1];
column family dummy,(loans balance avg_bal percnt estimated loss);
define family / group format= $8. "FAMILY"
style(header)=[background = CXDBE5F1]
style(column)=[background = CXDBE5F1];
define dummy / across format= $8. "MY SPANNING HEADER"
style(header)=[background = &color.];
define loans /*_c2_ */ / sum format= best9. "LOANS"
style(header)=[background = &color.];
define balance /* _c3_ */ / sum format= best9. "BALANCE"
style(header)=[background = &color.];
define avg_bal /*_c4_*/ / computed format= best20. "AVG BALANCE"
style(header)=[background = &color.];
define percnt /*_c5_*/ / computed format= percent10.3 "BAL (%) OF TOTAL"
style(header)=[background = &color.];
define estimated /*_c6_*/ / sum format= best9. "ESTIMATED"
style(header)=[background = &color.];
define loss /*_c7_*/ / sum format= best9. "LOSS"
style(header)=[background = &color.];
** Must use Absolute column numbers in these compute blocks;
** total_bal is a temporary report item, so it does not need to;
** use the absolute column number;
compute before;
total_bal = _c3_;
endcomp;
compute percnt;
_c5_ = _c3_/total_bal;
endcomp;
compute avg_bal;
_c4_ = _c3_/_c2_;
endcomp;
rbreak after /
summarize
style(summary) = Header{font_weight = bold
font_face = 'Arial, Helvetica, Sans-Serif'
background = &color
foreground = black};
** instead of changing the summary line for every report item, make the whole;
** summary line the color you want and then change the summary cell for FAMILY;
** to be the same color as the rest of the cells. It simplifies the code.;
compute after;
family = 'TOTAL';
call define('family','style',"style=[background=CXDBE5F1]");
endcomp;
run;
ods tagsets.excelxp close;
- Mark as New
- Bookmark
- Subscribe
- Mute
- RSS Feed
- Permalink
- Report Inappropriate Content
Thanks alot Cynthia. The absolute column in the compute block does the trick. I was able to use it to my actual work. It works perfectly and I learned something new. Thanks again.
.jpg")
Catch up on SAS Innovate 2026
Nearly 200 sessions are now available on demand in the Innovate Hub.
Watch Now →Learn how use the CAT functions in SAS to join values from multiple variables into a single value.

Find more tutorials on the SAS Users YouTube channel.
SAS Training: Just a Click Away
Ready to level-up your skills? Choose your own adventure.
-
2 replies
-
06-11-2013 12:49 PM
-
5050 views
-
0 likes
-
2 in conversation
-
